Economic Analysis and Diagram Use
Description, assertion and analysis
These operations are different:
- description states what happened or what a model shows;
- assertion states a conclusion without establishing why it follows;
- analysis explains how and why an initiating change produces an outcome through agents, incentives, constraints and adjustment.
Example:
Description: Interest rates fell and investment rose.
Assertion: Lower interest rates cause economic growth.
Analysis: Lower interest rates reduce the cost of borrowing and the opportunity cost of using retained earnings. If expected returns remain favourable, firms increase planned investment. Aggregate demand rises in the short run, and productive capacity may expand later if the investment adds effective capital.
The third statement identifies the agent, incentive, response, transmission and distinct short-run and long-run effects.
The anatomy of a causal chain
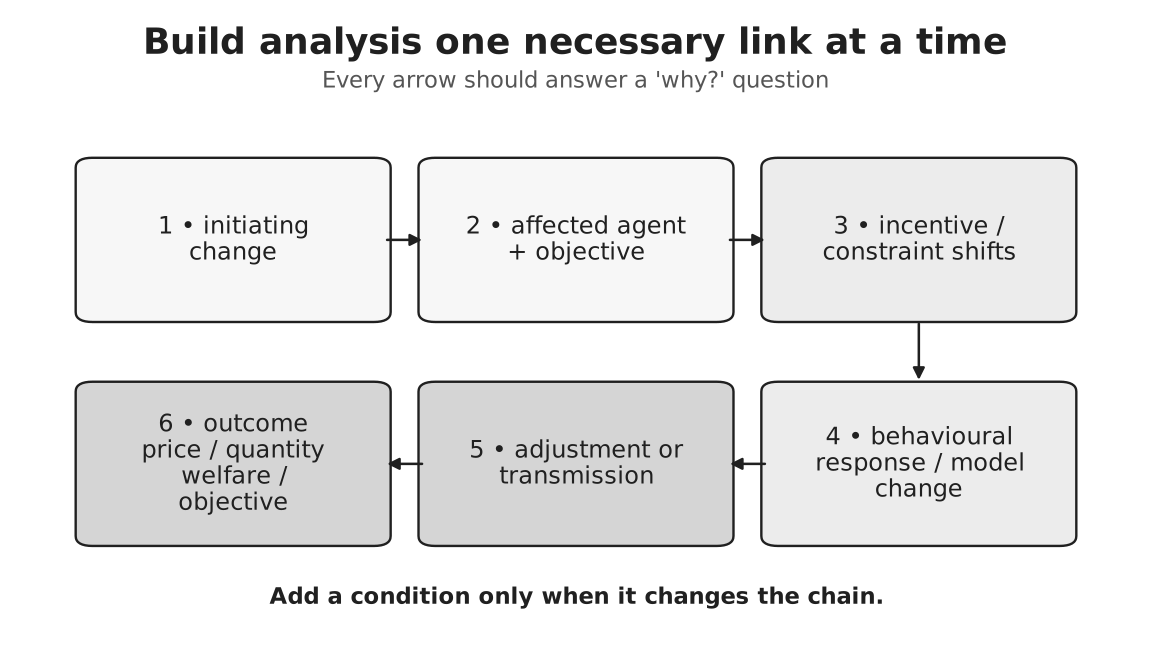
Caption: Read left to right. The chain begins with a changed determinant, then identifies whose incentive or constraint changes, how that agent responds, how the relevant model or adjustment process records the response, and which final objective or welfare outcome follows. The “why?” checkpoints under the arrows are diagnostic: if a student cannot justify one arrow, the written analysis contains a logical jump.
A complete chain often contains six jobs:
- Initiating change: what changes first?
- Agent: who notices or experiences the change?
- Incentive or constraint: why should behaviour change?
- Behaviour or model change: what action, movement or curve shift occurs?
- Adjustment/transmission: how does the market or economy move toward the new outcome?
- Relevant outcome: which price, quantity, welfare measure or objective changes?
Not every paragraph requires six separate sentences, but the logic must be recoverable.
A worked microeconomic chain
Suppose the government imposes a per-unit tax on a good.
- The tax raises the marginal cost of supplying each unit.
- Producers require a higher market price to supply any given quantity, so supply shifts vertically upward/left by the tax per unit.
- At the original price, quantity supplied is now below quantity demanded: a shortage creates upward pressure on the buyer price.
- The new equilibrium has a higher price paid by buyers and a lower price received by sellers net of tax.
- Equilibrium quantity falls.
- Consumer and producer surplus fall; government gains tax revenue; deadweight loss arises from mutually beneficial trades no longer occurring, unless the tax corrects an external cost.
The final qualification matters. With a negative externality, some reduction in quantity may improve allocative efficiency rather than simply create an undesirable loss.
A worked macroeconomic chain
Suppose consumer confidence falls.
- Households become more cautious about future income and employment.
- At each current income level, desired consumption falls and saving rises.
- Aggregate demand shifts left.
- Firms experience unplanned inventory accumulation and reduce production.
- In the comparative-static AD–AS model, real output, derived demand for labour and the general price level fall relative to the initial equilibrium. A claim about slower inflation would require a separate time-series interpretation.
- Through multiplier rounds, lower household income causes further induced reductions in consumption.
The magnitude depends on spare capacity, the marginal propensity to consume, leakages, expectations and policy response.
Build only necessary links
More arrows do not automatically mean deeper analysis. Include a link when it does one of these jobs:
- identifies an incentive or constraint;
- explains behavioural response;
- describes market adjustment or macroeconomic transmission;
- distinguishes a movement from a shift;
- links an intermediate result to the outcome asked about;
- states a material condition.
Remove a sentence that merely repeats the previous sentence in different words.
Diagram integration: a three-part contract
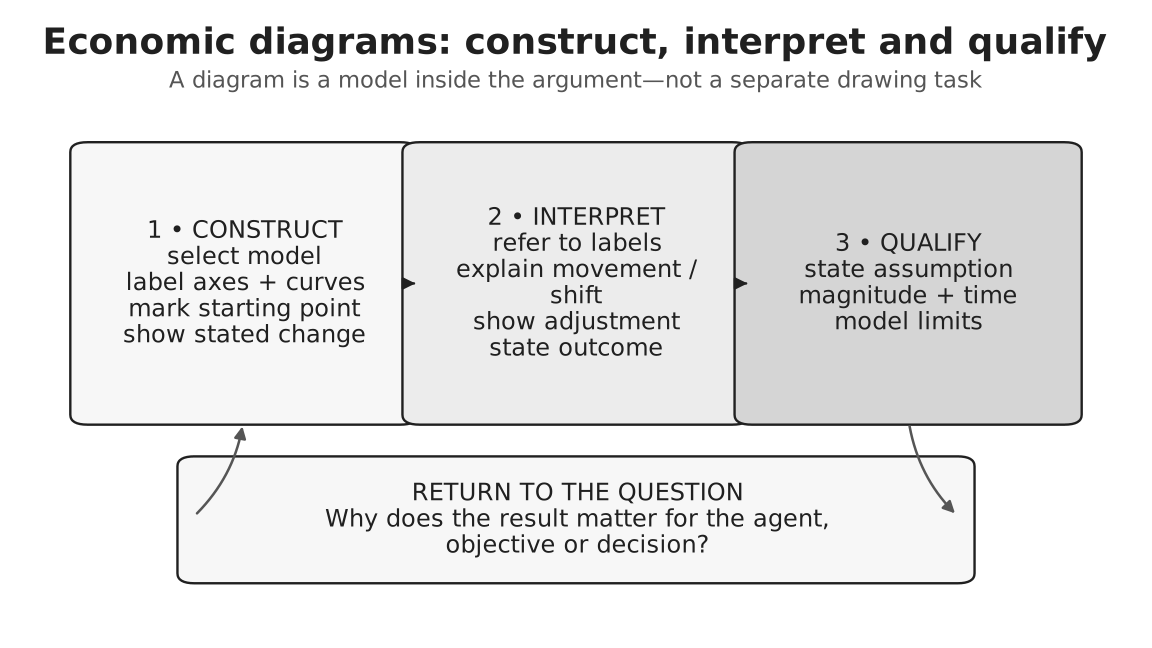
Caption: The figure has three large stages. Construct means choose the model and draw accurate axes, curves and starting position. Interpret means show the relevant movement, shift or other model change and explain the labelled adjustment in prose. Qualify means state only assumptions or limits that affect the conclusion. The loop back to the question prevents diagram dumping: every visual element must serve the stated issue.
1. Construct accurately
Choose a model that captures the central relationship:
- demand and supply for a market;
- externality analysis for private and social marginal effects;
- cost and revenue curves for firm output and profit;
- AD–AS for economy-wide real output and price-level changes;
- foreign-exchange demand and supply for currency movements;
- PPC for scarcity, productive capacity and opportunity cost.
Include the axes, relevant curves and initial position. Add a title or contextual label if it prevents ambiguity.
2. Interpret in prose
Refer explicitly to labels:
The per-unit tax raises firms’ marginal cost, shifting supply from to . At the original price , a shortage emerges. The market adjusts to a higher buyer price and lower equilibrium quantity ; sellers receive net of tax.
The diagram records relationships. The prose explains causality.
3. Qualify materially
State a model assumption only when it changes the inference. Examples include:
- ceteris paribus;
- spare capacity;
- elasticity and time horizon;
- information and mobility;
- small-country assumption in trade analysis;
- whether firms can pass costs into prices.
Listing every textbook assumption wastes time and weakens focus.
A diagram audit
| Element | Accuracy question | Common error |
|---|---|---|
| axes | Are both variables and units/concepts correct? | reversing price and quantity; undefined exchange-rate quotation |
| curves | Is each curve labelled and economically meaningful? | shifting the wrong curve |
| initial point | Is the starting equilibrium or optimum visible? | showing only the final position |
| initiating change | Is the determinant identified? | writing “demand increases” without a cause |
| movement/shift | Is direction consistent with the cause? | shifting demand because the good’s own price changes |
| adjustment | Is shortage, surplus or transmission explained where relevant? | jumping directly to the new equilibrium |
| outcome | Are new price, quantity, output or welfare labels consistent? | diagram and prose predicting opposite directions |
| area | Is the region bounded by the correct marginal curves? | treating tax revenue as deadweight loss |
| prose | Does the answer refer to labels? | diagram dumping |
Movement, shift and adjustment
Demand and supply
- A change in the good’s own price causes a movement along a given demand or supply curve.
- A non-price determinant shifts the relevant curve.
- A shift creates shortage or surplus at the old price; price changes are part of the adjustment to the new equilibrium.
AD–AS
- higher planned expenditure shifts AD;
- higher unit production cost shifts SRAS left;
- greater productive capacity shifts LRAS right;
- productivity improvement can shift both SRAS and LRAS right;
- actual growth may occur through higher AD when spare capacity exists, but sustainable potential growth requires productive-capacity expansion.
Firm diagrams
- changed demand conditions shift average and marginal revenue;
- fixed cost changes average cost but not marginal cost;
- variable cost changes can affect both average and marginal cost;
- profit-maximising output occurs where under the usual crossing condition, but profit depends on average revenue relative to average cost.
Externalities
First identify the source of divergence:
- marginal private benefit versus marginal social benefit; or
- marginal private cost versus marginal social cost.
Then locate market and socially efficient quantities. Do not memorise a triangle direction without checking the curves that bound the welfare loss.
Welfare language must name the object
Possible objects include:
- consumer surplus;
- producer surplus or profit;
- government revenue or expenditure;
- external cost or benefit;
- net social benefit;
- deadweight loss.
Tax revenue is a transfer to government, financed through the tax burden on buyers and sellers. It is not automatically a net social gain or a deadweight loss. Deadweight loss represents net benefits forgone because output or exchange differs from the allocatively efficient level.
Quantitative discipline
Where values are supplied:
- calculate rather than estimate by eye;
- show formula and substitution;
- retain units;
- distinguish percentage points from percentage change;
- interpret the result;
- round consistently.
In a wiki-generated diagram, intersections and areas should be calculated from explicit functions or data. In an examination sketch, exact scale is usually unnecessary unless values are supplied, but internal relationships must remain consistent.
What diagrams cannot show by themselves
A standard diagram may show direction under its assumptions, but often cannot establish:
- the numerical size of a real-world effect;
- how quickly adjustment occurs;
- which causal factor initiated an observed change;
- whether other curves also shifted;
- distribution within a broad group;
- institutional feasibility;
- the final policy ranking.
Those require evidence and written evaluation.
Diagram use when not explicitly requested
The audited Paper 2 stems rarely used the word diagram, yet answer guides often relied on diagrams when a model was central. Diagram selection can therefore be part of applying the correct economics.
Use a diagram when omitting it would leave an important analytical relationship vague. Do not use one when the question is chiefly institutional or comparative and the graph adds no mechanism.
Common errors
- Missing, reversed or undefined axes.
- Shifting a curve because its axis variable changes.
- Shifting two curves without two separate causes.
- Showing an outward LRAS shift when only current AD increases.
- Claiming profit rises from a new output without checking average cost and revenue.
- Shading a welfare area not bounded by relevant marginal curves.
- Showing the correct picture but narrating the opposite change.
- Using a diagram whose assumptions contradict the question context.
- Failing to state which currency’s price appears on a foreign-exchange axis.
- Drawing a diagram and never referring to it.
Final diagnostic
For every arrow in a plan or diagram, ask:
- Which agent responds?
- What incentive or constraint causes the response?
- Which economic variable or model changes?
- What adjustment or transmission occurs?
- Which requested outcome follows?
- Which material condition could alter the result?
Return to Case Study and Essay Skills.