Paper 1 Case Study Skills
Know the official task
Paper 1 contains two compulsory 30-mark case studies in 150 minutes. Each case presents two to three pages of textual, numerical or graphical data followed by six or seven part-questions, including sub-parts. About 12 marks per case are data response and about 18 are higher order.
The case material is not background decoration. It supplies:
- the contemporary economic issue;
- relevant variables and changes;
- competing claims or perspectives;
- policy objectives and constraints;
- evidence with strengths and limitations; and
- the context needed to apply and evaluate theory.
In the audited school-paper corpus, all 38 cases ended with one 8-mark and one 10-mark higher-order part. This is a strong recurring pattern, not an official guarantee.
Treat the stimulus as an evidence system
An extract, table and graph may perform different jobs:
| Stimulus element | Possible analytical job |
|---|---|
| text describing a policy | identify instrument, objective and transmission mechanism |
| stakeholder quotation | reveal a perspective, claim or possible bias |
| time-series table | establish trend, volatility, turning point or relative change |
| index | compare change relative to a base period |
| graph of two variables | identify association and test whether causation is justified |
| forecast | support a conditional prediction while retaining uncertainty |
| contextual fact | determine which model, assumption or evaluation condition matters |
Do not ask only “What does this extract say?” Ask “What claim could this evidence support, challenge or qualify?”
A reliable but adaptable workflow
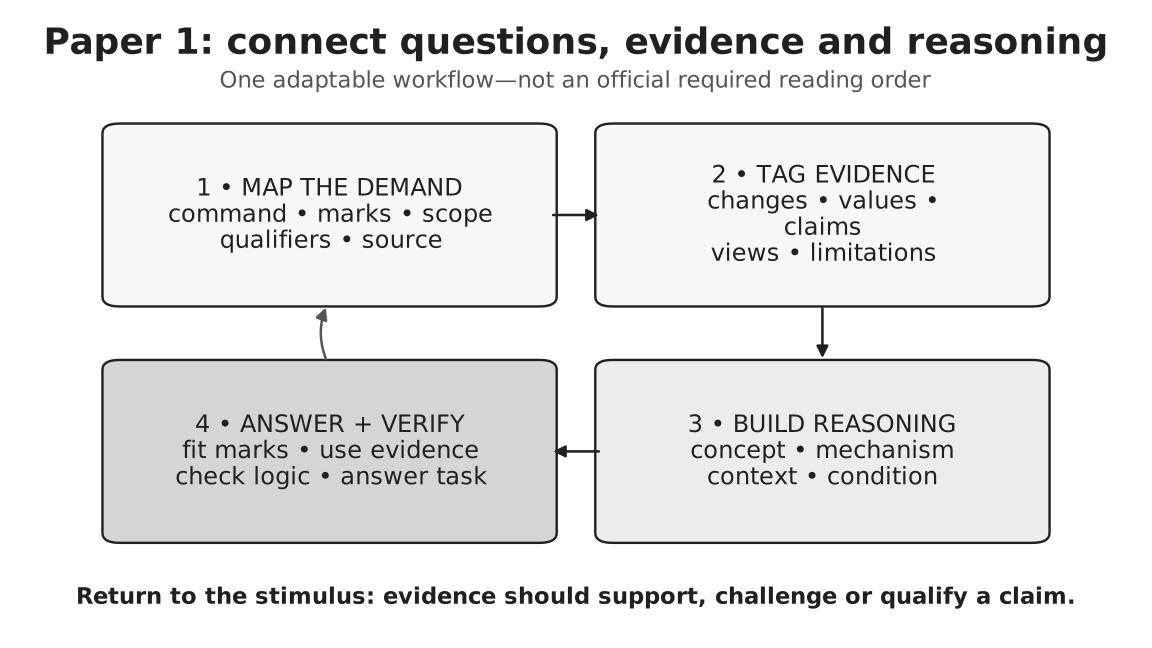
Caption: Begin with the question-demand card, then connect relevant evidence to the required economics before drafting the answer. The return arrows show that a candidate should revisit the stimulus to verify values, context and limitations rather than rely on memory after one reading. The workflow may begin with a brief case survey or a question survey; what matters is that command, evidence and reasoning remain connected.
1. Survey the demand
For each part, identify:
- command word;
- marks;
- named extract, table or figure;
- economic object or relationship;
- qualifier such as “most effective”, “in the short run” or “for households”; and
- whether a calculation, diagram, comparison or judgement is required.
A compact margin code can help:
C = command | E = evidence | M = model | J = judgement
2. Read and annotate selectively
Use functional tags rather than highlighting whole paragraphs:
Δfor a change;CAUSEorEFFECTfor a claimed mechanism;OBJfor an objective;POLfor a policy instrument;CONfor a constraint;STAKEfor a stakeholder view;LIMITfor uncertainty or a limitation;+Qfor numerical evidence worth quoting.
An annotation should tell you how the evidence could be used.
3. Build an evidence map
| Question demand | Relevant evidence | Economic concept/model | Limitation or condition |
|---|---|---|---|
| explain imported inflation | import-price rise; exchange-rate change | SRAS or import-cost channel | firms may absorb margins; import share matters |
| assess employment effect | vacancy data; output forecast | derived demand for labour; AD–AS | skills mismatch; forecast uncertainty |
| compare two policies | costs, timing and target groups | transmission of each policy | feasibility and opportunity cost |
This prevents quotation dumping and ensures evidence is selected for a reason.
Interpreting numerical and graphical data
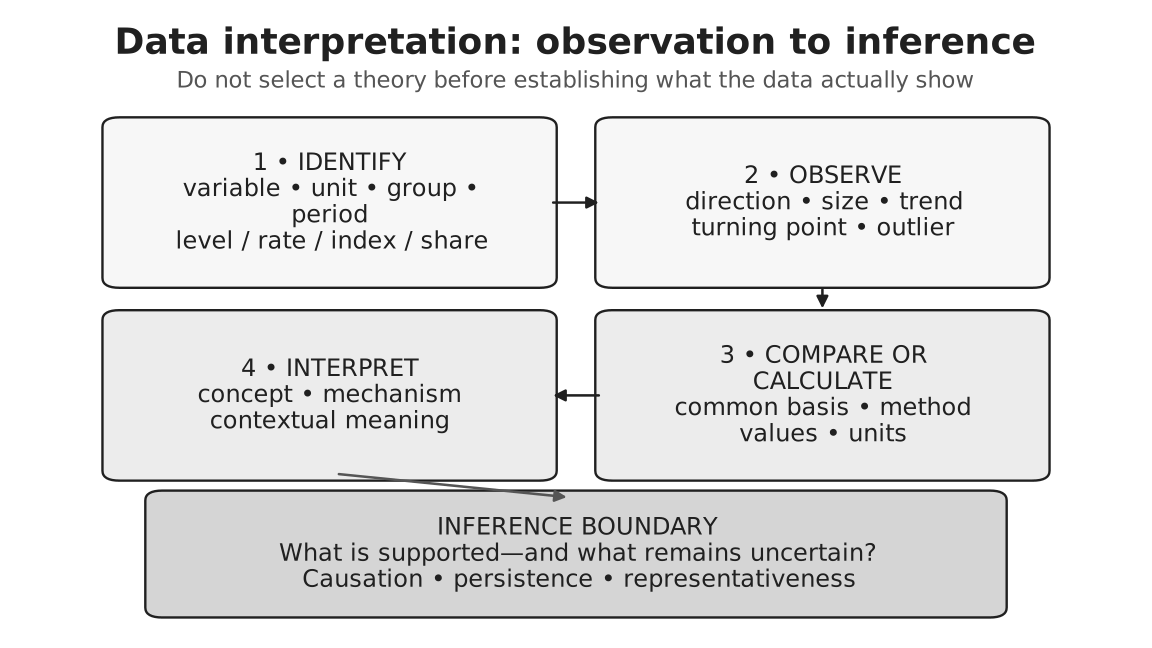
Caption: Read from the data-identification card through observation and calculation to interpretation. The final boundary card asks what the evidence cannot establish—for example, causation, representativeness or a long-run trend. Observation and calculation should come before theory; otherwise a student may force the data to fit a preselected story.
First audit the data
Before describing a number or line, check:
- variable;
- unit;
- country, market or group;
- time period;
- nominal or real basis;
- total or per-capita basis;
- level, rate, index or share;
- legend, scale and source.
Absolute change, percentage change and percentage points
Suppose unemployment rises from 4% to 5%:
- absolute change in the unemployment rate: percentage point;
- percentage change in the unemployment rate: .
These answer different questions. A one-percentage-point rise is not a one-percent rise.
Suppose real output rises from $200 billion to $210 billion:
State the formula, substitute accurately, retain units and interpret the result.
Index numbers
If an index uses base year :
- an index of 120 means the variable is 20% above its 2025 level;
- a fall from 120 to 114 is a 5% fall relative to the initial index value of 120, because ;
- an index of 120 does not mean the level is 120 units.
For a price index, a higher index means a higher price level. Inflation refers to the rate of increase of the price level. Falling inflation means prices are rising more slowly; it is not deflation unless the price level itself falls.
Level, rate, share and total
Avoid these common confusions:
- high GDP is not the same as high GDP growth;
- high price level is not the same as high inflation;
- lower inflation is not necessarily lower prices;
- lower export share is not necessarily lower export value;
- higher total income is not necessarily higher income per person.
Nominal, real and per capita
Nominal values include price changes. Real values adjust for the general price level. Per-capita values divide by population.
If nominal GDP grows by 6% while the general price level rises by about 4%, real GDP growth is approximately 2%, using the approximation:
The approximation is useful for interpretation but may differ slightly from an exact calculation.
A worked comparison
Suppose a table reports:
| Year | Real GDP growth | Inflation | Unemployment |
|---|---|---|---|
| 2027 | 1.0% | 5.2% | 3.1% |
| 2028 | 2.8% | 3.6% | 2.7% |
A strong comparison is:
From 2027 to 2028, real GDP growth increased by 1.8 percentage points, while inflation fell by 1.6 percentage points and unemployment fell by 0.4 percentage points. The figures are consistent with improving output and labour-market performance alongside disinflation, but two observations do not establish the cause of these changes or whether they will persist.
It compares, quantifies, interprets and qualifies.
Correlation, causation and inference
Two variables moving together establish association, not necessarily causation. A careful chain is:
- state the observed relationship;
- propose a plausible economic mechanism;
- ask whether reverse causality is possible;
- identify a third factor that could affect both variables;
- qualify confidence using period, sample or measurement.
For example, higher education spending and higher productivity may move together. Spending could improve human capital, but richer economies may also be able to spend more, and institutional quality may influence both.
Use evidence inside the argument
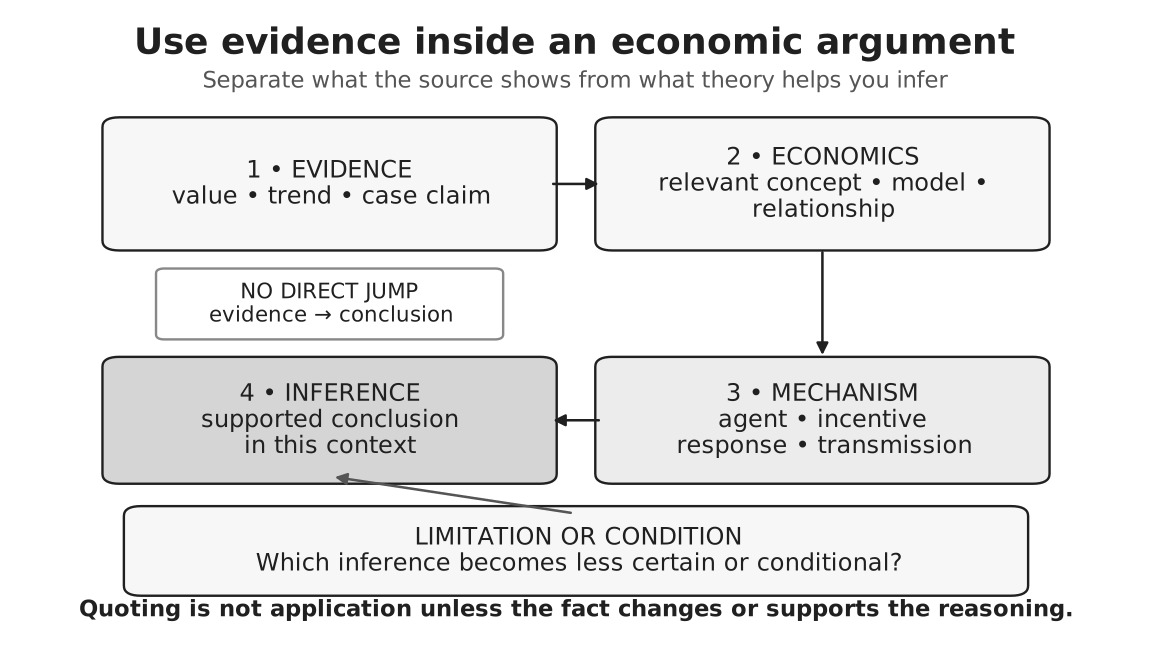
Caption: Begin with one precise case fact. Move through a relevant concept and causal mechanism before stating the contextual inference. The warning band shows that jumping directly from a value or quotation to a conclusion produces an unsupported claim. A limitation should be attached to the inference it weakens, not added as a generic final sentence.
Weak:
Extract 2 says energy prices rose.
Stronger:
Extract 2 reports a sharp rise in imported energy prices. Since energy is a production input, firms’ unit costs rise and short-run aggregate supply may shift left, causing cost-push inflation and lower real output. The magnitude will be larger where production is energy-intensive and firms pass more of the cost increase to prices.
The evidence performs analytical work; it does not merely appear beside theory.
Comparing extracts or perspectives
Use a common basis of comparison:
- predicted direction or outcome;
- causal mechanism;
- assumption;
- affected stakeholder;
- time horizon;
- strength and type of evidence;
- policy implication.
Avoid writing a summary of Extract 1 followed by a summary of Extract 2. Use relational language:
Both extracts expect the policy to raise investment, but Extract 1 attributes the effect to lower financing cost, whereas Extract 2 emphasises improved business confidence. The first mechanism may be weaker when firms are pessimistic despite low interest rates.
Short-answer calibration
Let the command and marks determine the response.
| Demand | What normally earns credit |
|---|---|
| identify/state | direct, precise item or conclusion |
| compare | relational statement plus relevant evidence from both objects |
| calculate | method, substitution, answer and unit as appropriate |
| explain | one or more complete causal links, not disconnected facts |
| with reference to | selective case evidence used in the reasoning |
| using a diagram | accurate diagram plus prose explaining labels and adjustment |
A 4-mark explanation does not necessarily require four separate ideas. It often rewards one mechanism developed through several necessary links.
Higher-order case responses
For an 8- or 10-mark evaluative response, such as one using discuss, assess or evaluate:
- interpret the proposition and decision criterion;
- develop the strongest case-supported mechanism;
- develop a countervailing mechanism, limitation or alternative;
- compare arguments using evidence from the case;
- identify the condition or stakeholder that matters most;
- reach a judgement tied to the stated objective.
For a high-mark analyse response, develop the requested causal relationships fully and apply the case evidence; do not force a counterargument or final policy ranking unless the wording requires one. For compare, establish meaningful similarities or differences using common criteria and evidence. The command and complete question demand—not the mark value alone—determine whether evaluation and judgement are required.
Evidence breadth versus evidence quality
There is no official quota of extract references. One precisely selected fact, fully interpreted and connected to a mechanism, may do more work than several quotations. Longer responses usually need evidence from more than one part of the stimulus when the task asks for synthesis, but relevance remains more important than count.
Evaluating evidence
| Evidence feature | Inference weakened |
|---|---|
| short time period | persistence of a trend |
| nominal value | real output or purchasing-power claim |
| total rather than per-capita value | average living-standard claim |
| forecast | certainty about realised outcome |
| association between two variables | causal claim |
| one stakeholder quotation | representativeness of perspective |
| index without underlying level | absolute-magnitude claim |
Do not write “the source may be unreliable” without explaining which conclusion becomes less secure.
Diagram use in Paper 1
Use a diagram when it clarifies the tested mechanism. If the question explicitly says “using a diagram”, include:
- correct axes and initial curves;
- the change caused by the supplied evidence;
- the new equilibrium or welfare outcome; and
- prose referring to labels and adjustment.
If evidence indicates a tax on a good, for example, do not merely shift supply left. Explain that the per-unit tax raises firms’ marginal cost and creates a shortage at the original price, putting upward pressure on the buyer price and reducing equilibrium quantity.
Suggested pacing
Equal-mark pacing gives about 75 minutes per case. Within that time, a student must read, plan, answer short items, develop higher-order responses and check calculations. The exact split should be learned through timed practice; it is not prescribed officially.
Common failure modes
- Copying a sentence when the question asks for an inference.
- Comparing values without units or a relational statement.
- Confusing percentage change with percentage-point change.
- Treating an index as an absolute level.
- Claiming causation from two lines moving together.
- Using theory without case evidence where the question requires reference.
- Adding a generic data limitation unrelated to the conclusion.
- Spending essay-length time on a narrow short-answer part.
- Drawing a diagram without explaining it.
- Reaching a judgement that ignores the case objective or constraints.
Final check
- Did I answer every sub-part and qualifier?
- Did calculations show appropriate method and units?
- Did I distinguish observation from inference?
- Did evidence change or support the analysis?
- Did I state the mechanism between cause and outcome?
- Did any limitation target a specific claim?
- Did the judgement use the case’s objective and conditions?
- Did response depth match the marks?
Return to Case Study and Essay Skills.