Paper 1 Practice: Meridia’s Urban-Mobility Decision — Answers
Indicative guidance
The annotations identify assessed thinking; students need not use AO labels as headings.
Questions: Meridia’s Urban-Mobility Decision.
Question 1(a)(i) [2]
Demand was price inelastic over the observed change. The calculation shows association, not that price alone caused the quantity change.
Question 1(a)(ii) [2]
Additional journeys were 40 000; . The survey suggests approximately 6 800 average weekday off-peak journeys replaced car trips, subject to sampling and self-report limitations.
Question 1(b) [4]
One fully developed limitation can earn the available marks. For example, the minister infers causation from a before-and-after association: income, service frequency, events or seasonal travel may also have changed, so without a credible comparison group the trial cannot attribute every additional journey to the fare cut. Alternatively, a student could develop the voluntary-sample problem or show that the unchanged peak congestion and small estimated car-switching share do not support the claim that congestion was “solved”. Do not require every limitation.
Question 1(c) [4]
Passengers who use the metro gain consumer surplus from the lower fare, especially shift workers. Station-area shops may gain demand. However, taxpayers bear the subsidy and its opportunity cost; bus operators lose revenue when passengers substitute; walkers and cyclists switching modes may reduce active travel; crowding imposes discomfort on existing riders. Incidence and net benefit depend on access, capacity and whether trips replace cars.
Question 1(d) [8]
Success requires a stated criterion. If the objective was off-peak use or affordability, journeys rose 10% and low-income shift workers report gains. If the objective was congestion, only an estimated 6 800 additional journeys replaced cars, off-peak speeds improved only slightly and peak congestion was unchanged. Crowding and bus-revenue losses are counter-effects.
Table 1 strengthens that mixed finding: off-peak speed rose only from 31.4 to 31.9 km/h, peak speed slipped from 18.2 to 18.1 km/h, and the crowding index rose from 72 to 86. The M6.5 million monthly subsidy is an opportunity cost that must be compared with the value of accessibility gains.
Evidence quality is limited by voluntary sampling, absence of a control group, a short period and concurrent maintenance. PED of -0.5 suggests a relatively large fare reduction produced a smaller proportionate journey response. Yet new trips may create accessibility benefits not captured by road speeds.
The trial was partially successful for access but not demonstrably successful for peak congestion. A final judgement should remain criterion-specific and provisional pending representative ridership, distribution and capacity data.
Question 1(e) [10]
Road pricing directly makes peak driving reflect congestion costs and may change time, route or mode choices. It is targeted but regressive where alternatives are poor and costly to administer. Extra metro capacity enables substitution and reduces crowding but arrives slowly. Feeder buses broaden access and complement rail; a permanent broad fare subsidy is faster but weakly targeted at peak road use.
Meridia should sequence the policies: improve feeder services and reliability first, introduce road pricing where viable alternatives exist, and commit capacity investment on lines with robust demand. Retain targeted fare support for low-income users rather than the universal trial. The ranking depends on the primary objective, demand responsiveness, capacity, equity weights, implementation costs and opportunity cost. Credit alternatives that compare options using a common criterion and reach a supported conclusion.
Road pricing cannot begin immediately because equipment takes a year and diversion must be monitored. Capacity takes three years, while targeted support can act sooner. A defensible package should therefore distinguish immediate affordability measures from the longer-run capacity and congestion instruments.
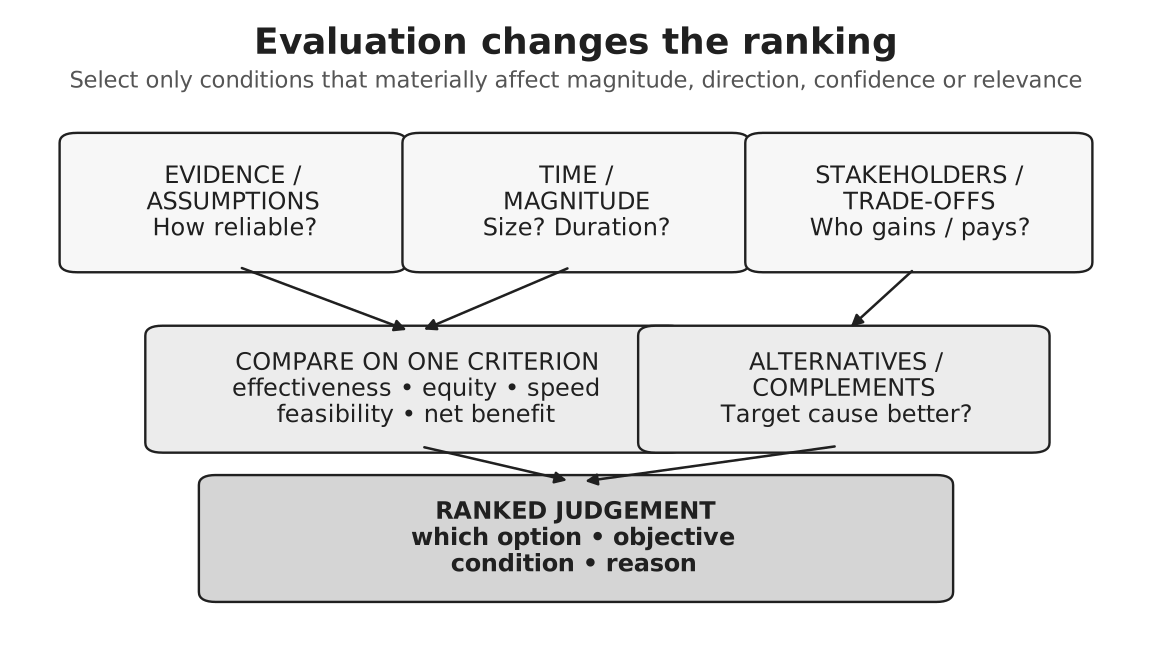
Caption: Strong evaluation selects the conditions that change policy ranking, compares alternatives against a common objective and then decides; it does not merely list generic drawbacks. The opening guidance applies: coherent alternative routes should receive credit.
Question-by-question formative marking framework
Use this with the shared Economics formative marking framework.
| Part | Full-credit job | Acceptable alternatives and diagnostic ceiling |
|---|---|---|
| 1(a)(i), 2 | Apply the requested original-value PED method, preserve the sign and interpret relative responsiveness. | Magnitude-only notation is acceptable if inelasticity is stated. Midpoint calculation answers a different method. |
| 1(a)(ii), 2 | Calculate additional journeys and apply the 17% estimate, with the average-weekday off-peak unit. | Correct arithmetic without the qualified unit normally earns 1. |
| 1(b), 4 | Develop one evidence limitation from assumption to its effect on confidence in the minister’s causal inference. | Sampling, confounding, missing control or outcome mismatch is valid. Four undeveloped labels should not receive full credit. |
| 1(c), 4 | Trace benefits and costs to distinct stakeholders and explain incidence or opportunity cost. | Any balanced stakeholder pair is valid. Naming groups without mechanisms should receive limited credit. |
| 1(d), 8 | Define success criteria, weigh access against congestion evidence, test evidence quality and give a criterion-specific judgement. | Different verdicts are valid. Declaring success from ridership alone should normally remain below 6. |
| 1(e), 10 | Compare fare support, road pricing, feeder services and capacity using effectiveness, equity, timing and feasibility; recommend a sequenced package. | A single policy can be defended if alternatives are genuinely compared. A generic list without common criteria should normally remain below 8. |
Common misconceptions
- A before-and-after association does not by itself establish causation.
- A voluntary survey does not represent non-users automatically.
- Increased ridership is not sufficient evidence that road congestion fell.
- Evaluation is not a list of drawbacks; it changes confidence or policy ranking under stated conditions.
Student self-check
Have I used the requested elasticity method, retained the correct population and time unit, developed one limitation fully, defined “success”, and compared policies against the same objective before judging?