Production Possibility Curve
Definition and assumptions
A production possibility curve (PPC) shows the maximum combinations of two goods or categories of goods that an economy can produce in a given period with its current resources and technology, assuming resources are fully and efficiently employed.
The standard model assumes:
- only two goods or categories are shown;
- resource quantity and quality are fixed;
- technology is fixed;
- resources on the boundary are fully and efficiently employed.
These ceteris paribus assumptions isolate the production trade-off. They do not claim that a real economy literally produces only two goods or never changes.
A visual-reading checklist
Before interpreting any PPC:
- Read both axis labels and units.
- Identify whether the point lies on, inside or outside the boundary.
- Check whether an arrow moves along a curve, toward a curve, or shifts the entire curve.
- Identify what is gained and what is forgone.
- State what is held constant—normally resources and technology for a movement along the same PPC.
- Do not infer preferences, fairness or prices unless additional information is supplied.
Points relative to the PPC
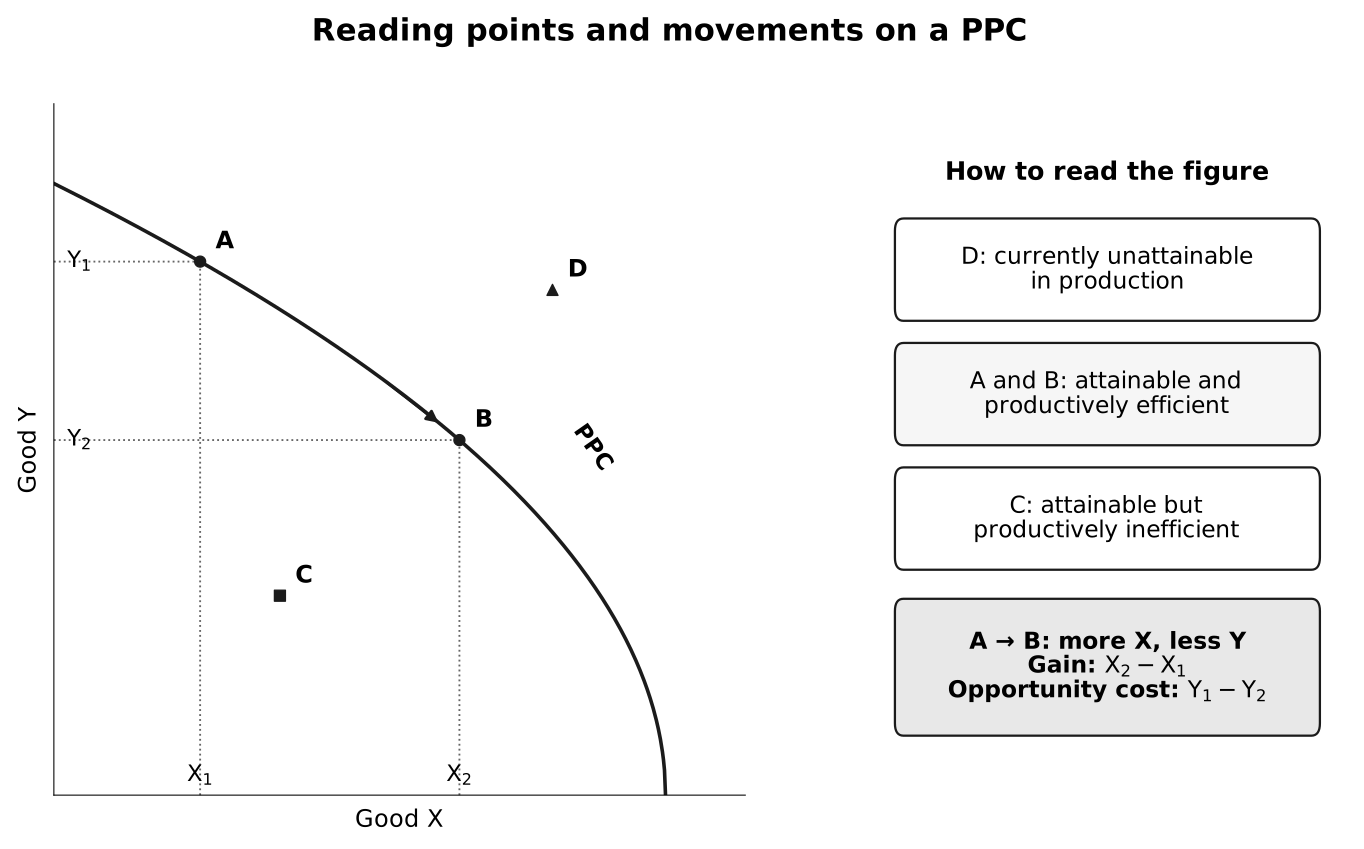
Caption: The axes measure outputs of Goods X and Y. A and B lie on the same PPC; their projections give and . Moving A→B raises X by and reduces Y by . C is attainable but productively inefficient, while D is currently unattainable in production. The curve and points describe productive possibilities, not which output mix society prefers.
Efficiency and employment are related but distinct
| Concept | Meaning | PPC representation | Important qualification |
|---|---|---|---|
| Full employment | available resources are employed | normally on the boundary if use is also efficient | employment alone does not guarantee best organisation |
| Productive efficiency | maximum output from given resources/technology | every point on the PPC | says nothing about whether the mix is socially preferred |
| Productive inefficiency | more output is possible with current capacity | a point inside the PPC | may reflect unemployment, underemployment or poor organisation |
| Allocative efficiency | output mix maximises social welfare given preferences | not identifiable from the PPC alone | needs information about preferences and marginal social benefits/costs |
Inside the curve
An interior point is attainable but productively inefficient. Unemployment means resources are not employed. Underemployment means resources are employed below their productive potential—for example, workers’ skills or desired working hours are underused. Either condition, as well as idle factories or inefficient organisation, can place production inside the PPC.
Movement from inside toward the curve can increase one or both outputs without increasing productive capacity. However, not every path has zero opportunity cost in terms of the other good: a movement that reduces one good still involves a trade-off.
Outside the curve
An exterior point is currently unattainable in production. International trade may allow consumption beyond a domestic PPC, but it does not permit domestic production beyond the boundary unless productive capacity changes.
Movement along the PPC
A movement along the same PPC reallocates resources:
- more of one good is produced;
- less of the other good is produced;
- resources and technology are held constant.
For a discrete movement, the opportunity cost per additional unit of X is:
Always state the unit—for example, “ units of textiles per additional computer.” The negative slope represents a trade-off; the absolute value reports the amount forgone.
Increasing opportunity cost
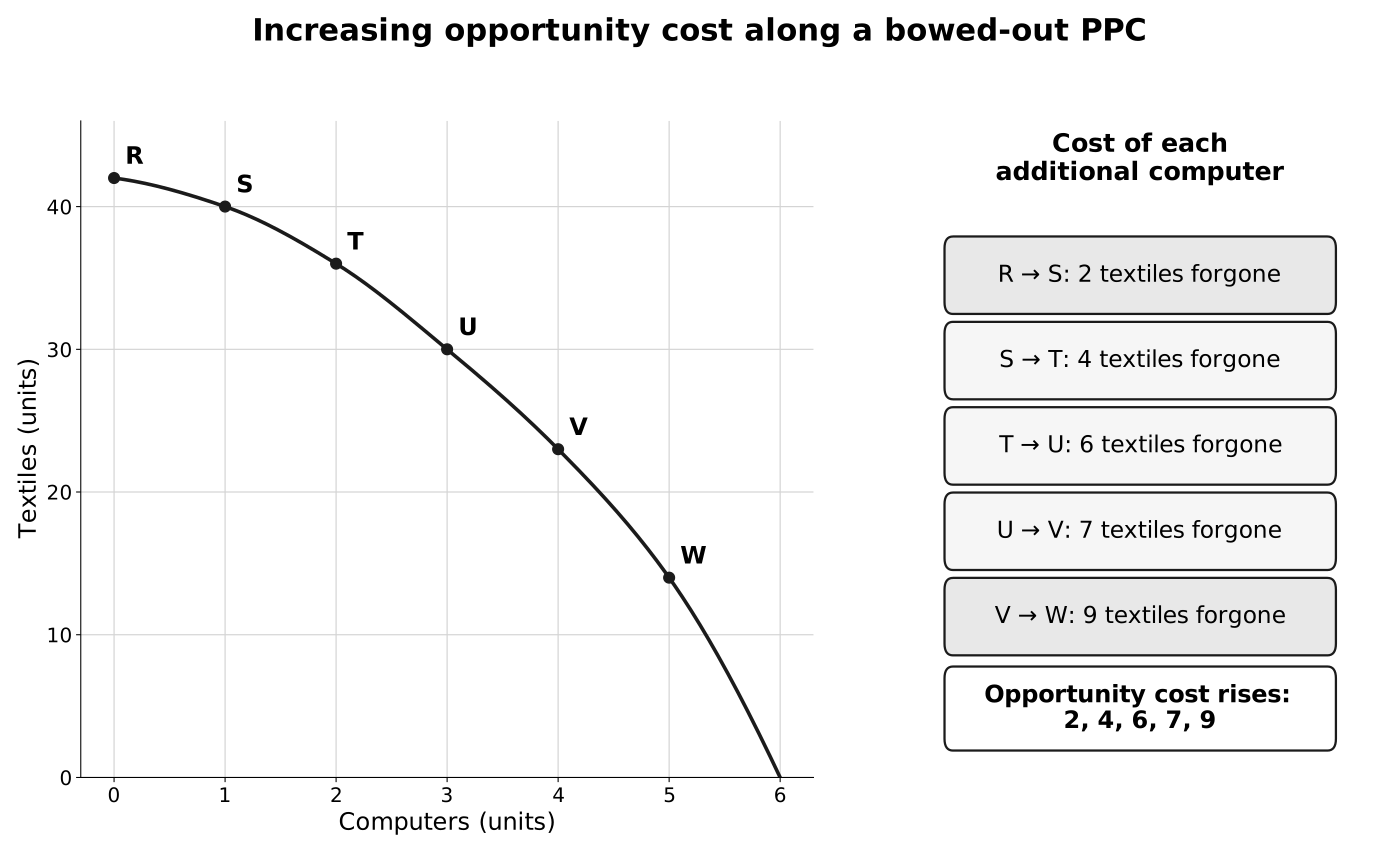
Caption: Read the combinations R→W and the matching step boxes. Computers rise by one unit each time, while textile output falls by , , , and units. The opportunity cost of an additional computer therefore rises. The smoothed boundary passes through the stated data; the successive differences, not the visual steepness alone, establish the numerical opportunity costs.
| Combination | Computers | Textiles | Opportunity cost of the additional computer |
|---|---|---|---|
| R | 0 | 42 | — |
| S | 1 | 40 | 2 textiles |
| T | 2 | 36 | 4 textiles |
| U | 3 | 30 | 6 textiles |
| V | 4 | 23 | 7 textiles |
| W | 5 | 14 | 9 textiles |
Opportunity cost rises because resources are imperfect substitutes between uses. Resources moved first may be reasonably suitable for computers. Later transfers draw increasingly specialised resources away from textiles, so more textile output must be sacrificed.
If resources were equally adaptable, opportunity cost would be constant and the PPC would be a straight line.
Movements and shifts: one taxonomy
| Change shown | Meaning | Capacity changes? | Common cause |
|---|---|---|---|
| along the PPC | reallocation between goods | no | changing output priorities |
| inside → toward PPC | fuller/more efficient use of existing resources | no | falling unemployment or better organisation |
| entire PPC outward | greater productive capacity | yes | more/better resources or technology |
| entire PPC inward | reduced productive capacity | yes | disaster, war or resource loss |
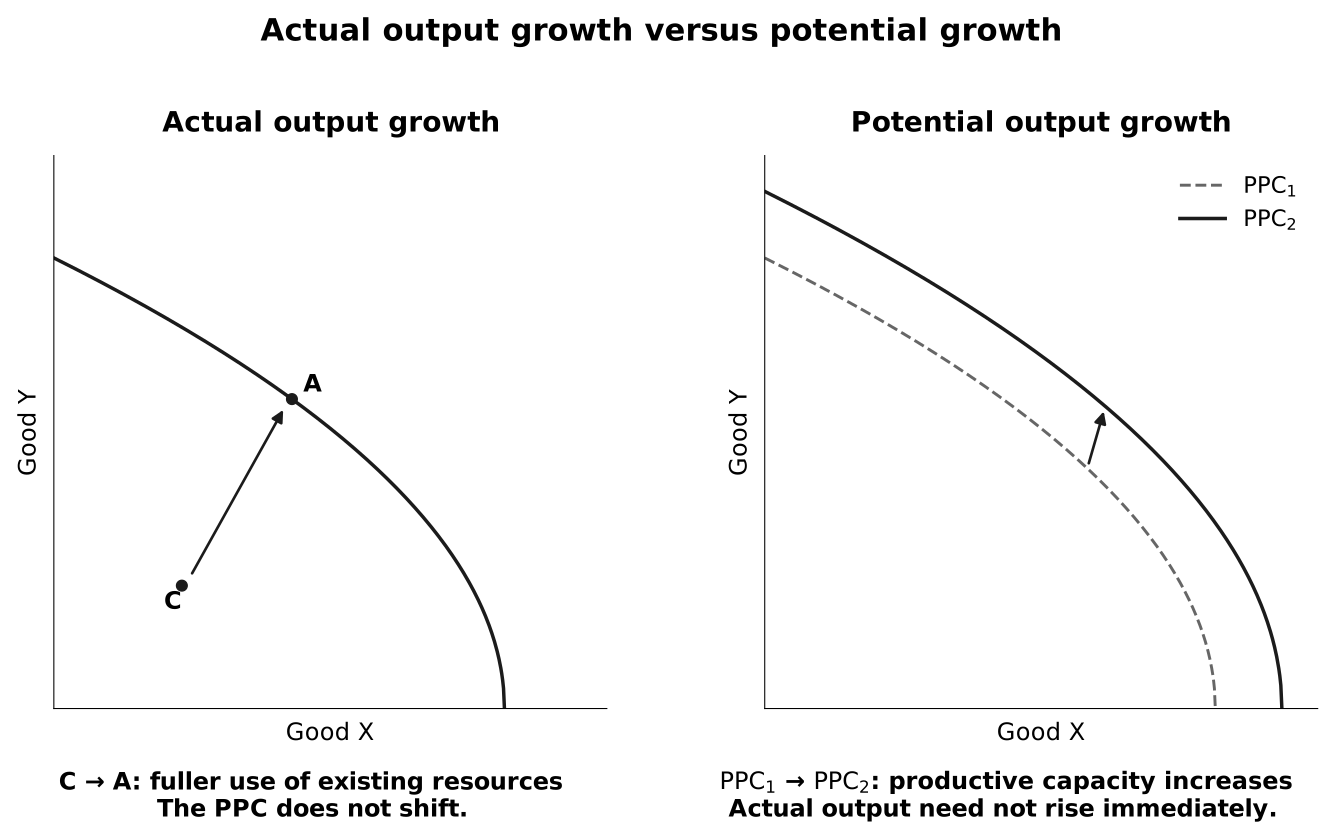
Caption: The left panel holds the PPC fixed. C→A uses existing resources more fully, so actual output rises without a capacity shift. The right panel moves the boundary from to , showing higher maximum possible output. This is potential growth; actual output increases only if the economy uses the additional capacity.
Actual growth
Actual economic growth is an increase in real output over time. A PPC can illustrate it as a movement from an interior point toward the boundary if the later combination represents more total real output.
Movement along a boundary is not automatically growth: one good rises while another falls, so whether aggregate real output has increased cannot be inferred merely from the arrow.
Potential growth
An outward shift represents increased productive capacity. Causes include:
- more labour or natural resources;
- improved education, training or health;
- capital accumulation;
- technological progress;
- stronger institutions or productivity.
The shift may be parallel if both sectors benefit similarly, or biased toward one axis if a change mainly raises capacity in one sector. An outward shift does not guarantee immediate actual growth.
Inward shift
War, natural disaster, resource depletion or institutional deterioration can reduce capacity. This is different from a recession that leaves the PPC unchanged but moves actual production inward.
Consumption and investment
Resources can produce consumption goods for current use or capital goods that support future production.
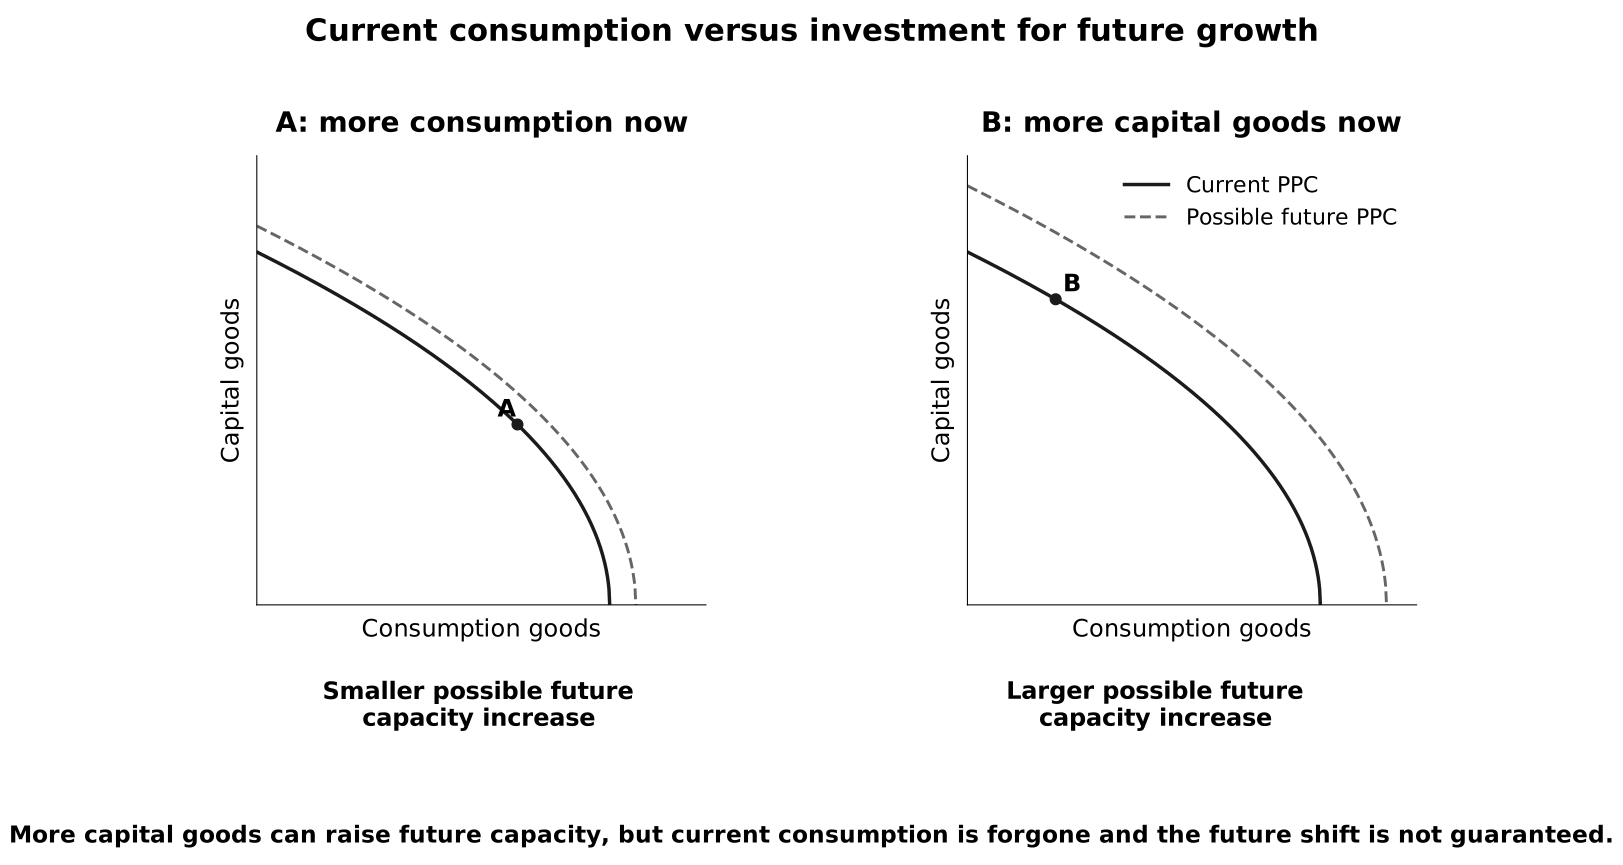
Caption: Both panels start from the same current PPC. A lies farther toward current consumption and is paired with a smaller future outward shift. B allocates more current resources to capital goods and is paired with a larger possible future shift. The dashed curves compare potential future capacities; they are not trajectories or guarantees.
The intertemporal chain is:
The opportunity cost is lower current consumption. A larger investment allocation may fail to deliver the expected capacity gain if projects are poorly selected, maintenance is inadequate, complementary skills are absent or technology becomes obsolete. Weak aggregate demand is different: it can leave actual output inside an enlarged PPC even when usable productive capacity has increased.
PPC applications and limitations
Standard of living
Producing on the PPC uses current capacity efficiently, but does not by itself maximise living standards. Welfare also depends on output mix, distribution, leisure, health, environment, imports and sustainability.
Unemployment and underemployment
A fall in unemployment or underemployment normally moves output toward the PPC. It does not by itself shift the boundary.
Limitations
- Real economies produce many goods.
- Resource quantity, quality and technology change.
- The model does not show prices or market coordination.
- Product quality and environmental depletion are hard to represent.
- Productive efficiency does not establish allocative efficiency, fairness or sustainability.
- A two-dimensional diagram cannot aggregate different goods without measurement assumptions.
Common pitfalls
- Calling an interior point unattainable.
- Treating full employment, productive efficiency and allocative efficiency as synonyms.
- Saying that every movement from inside to the boundary has zero opportunity cost.
- Calling a movement along the PPC economic growth simply because one good rises.
- Shifting the PPC when unemployment falls.
- Confusing production beyond the PPC with consumption beyond it through trade.
- Explaining a bowed-out PPC without resource specialisation or imperfect substitutability.
- Treating a future PPC as a guaranteed outcome.
Check your understanding
- Why can the PPC not locate allocative efficiency by itself?
- Calculate the opportunity cost of moving from T to U in Country M.
- Can a movement from an interior point to the boundary involve opportunity cost? Explain.
- Distinguish actual growth from potential growth using the figure.
- Give one example of a biased outward shift.
- Why might greater capital-goods production fail to produce the expected future shift?
Return to The Central Economic Problem.