Business Strategies, Efficiency, Welfare and Regulation
Strategies
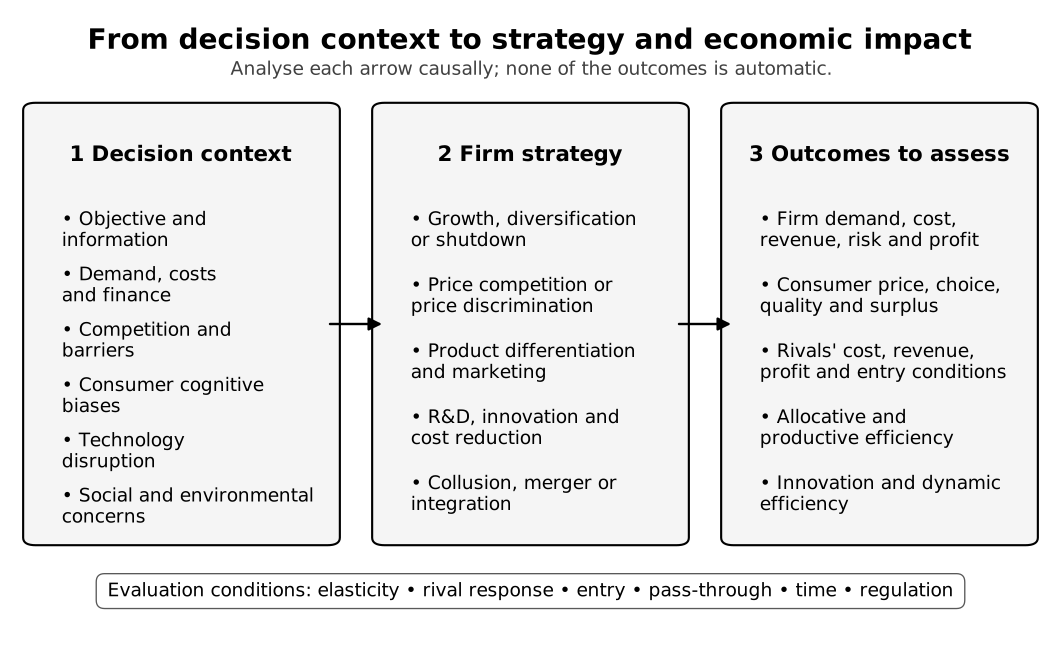
Caption: Read from left to right rather than treating the boxes as a list. The firm’s objective and information are constrained by demand, cost, finance, competition, technology and wider concerns. These conditions determine whether a strategy is feasible. Its consequences must then be separated into effects on the firm, consumers, rivals and efficiency, while elasticity, rival response, entry, pass-through, time and regulation determine the strength and even the direction of the result.
A reusable strategy-analysis chain
For any strategy, write the mechanism before evaluating it:
- state the action precisely;
- identify whether it changes demand, PED, fixed cost, marginal cost, capacity, barriers or rival expectations;
- use the firm’s objective to predict output and price;
- trace revenue, cost, profit and risk;
- trace price, quality, choice, access and consumer surplus;
- predict rival response, entry and longer-run adjustment;
- judge allocative, productive and dynamic efficiency conditionally.
This prevents a common weak answer: “advertising increases profit” or “a merger lowers cost” without explaining the missing causal steps.
Core strategies and useful extensions
Theme 2.2 explicitly names growth, diversification, shutdown, price competition, third-degree price discrimination, innovation/R&D, marketing and collusion. Limit pricing, predatory pricing, cost-plus pricing, outsourcing, automation and detailed merger/integration forms are useful anchor-note extensions. Apply them when relevant, but prioritise the named core strategies.
Growth, diversification and shutdown
- Organic growth: expanding the firm’s own capacity, products or locations; it may be slower but avoids integration problems.
- Merger or acquisition: faster access to capacity, technology, brands or distribution, but may create debt, culture clashes and weaker rivalry.
- Diversification: entering another product or market to seek growth or spread risk; weak expertise or lost focus can raise cost.
- Shutdown: temporary cessation when short-run revenue cannot cover variable cost; this preserves avoidable variable cost but does not remove fixed cost already committed.
Price strategies
- price competition: a price cut may raise quantity demanded and market share, but PED and rival responses determine revenue and profit;
- third-degree price discrimination: charging different prices to separated groups where elasticity differs;
- limit pricing: accepting lower current profit to make entry unattractive;
- predatory pricing: pricing aggressively to drive out existing rivals, potentially involving temporary loss;
- collusive pricing: coordinating price or output to increase joint profit, subject to cheating, entry and legal risk;
- cost-plus pricing: adding a mark-up to estimated unit cost when demand and MR are difficult to observe.
Non-price and cost strategies
- branding, advertising and product differentiation;
- research and development;
- service and quality improvement;
- process innovation, outsourcing and automation;
- vertical or horizontal integration and mergers.
Innovation may be product innovation, which changes quality or creates new demand, or process innovation, which lowers production cost. Marketing can inform consumers and differentiate a product, but it can also exploit limited attention or obscure comparison. Collusion can reduce uncertainty and avoid some duplicated investment for firms, yet may weaken rivalry and harm consumers.
The rational strategy depends on demand, elasticity, rivals, costs, finance, regulation and time horizon.
Existing and potential competition
Firms consider both existing competitors and potential entrants:
- Strong current rivalry makes a price increase more likely to lose sales and makes advertising, innovation or cost reduction more attractive.
- In an oligopoly, the effect of a strategy depends on whether rivals match it, undercut it or respond through non-price competition.
- Credible potential entry can constrain price and profit even when few firms are currently present.
- High legal, cost, brand, data or network barriers make entry less likely and may allow an incumbent to retain more of a cost saving as profit.
Process innovation or automation lowers unit cost only when productivity and input savings exceed implementation, financing and adjustment costs. If marginal or average cost falls, the firm can cut price, raise its margin, expand output, or combine these responses; PED, capacity and rival reactions determine the realised outcome.
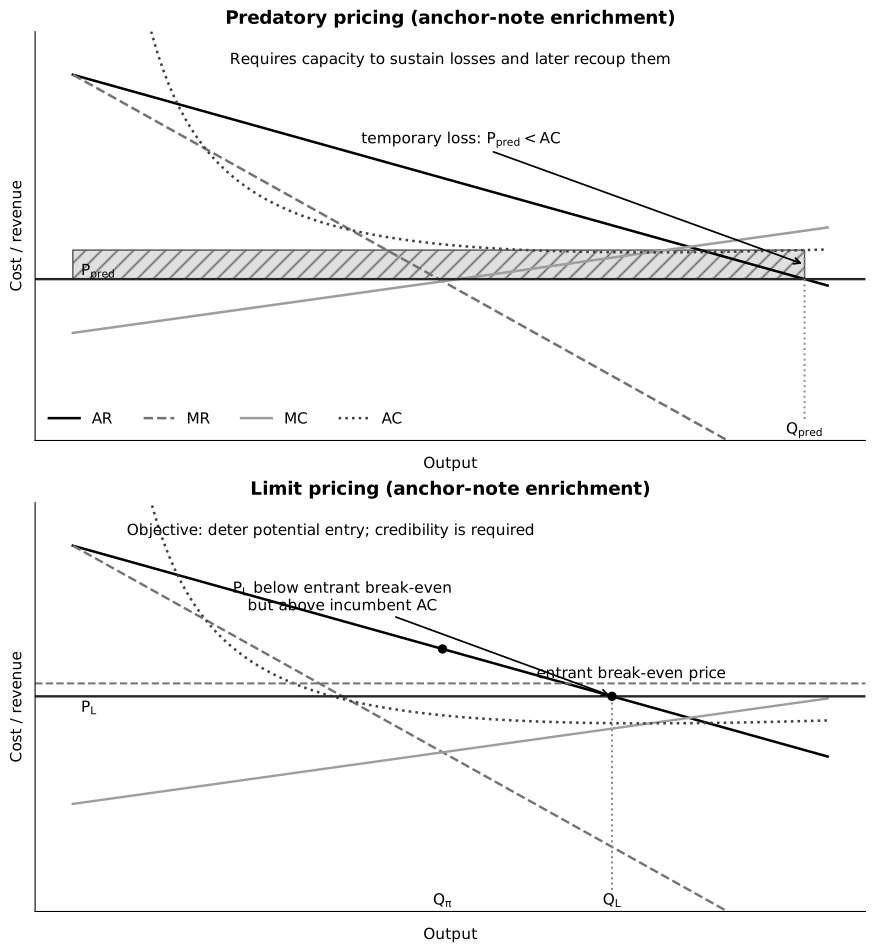
Caption: In the upper panel, predatory pricing targets existing rivals: the temporary price below AC creates a loss rectangle that the incumbent must be able to finance and later recoup if the strategy is to be rational. In the lower panel, limit pricing targets potential entrants: the incumbent accepts less current profit by charging a lower price and producing more so entry appears unprofitable. Neither strategy succeeds automatically; entrant cost, credibility, legal enforcement and later competition matter.
The two strategies are not interchangeable. Predation requires sufficient financial reserves and a credible prospect of later recouping losses. Limit pricing works only if potential entrants believe the incumbent will maintain the low price or expand output after entry.
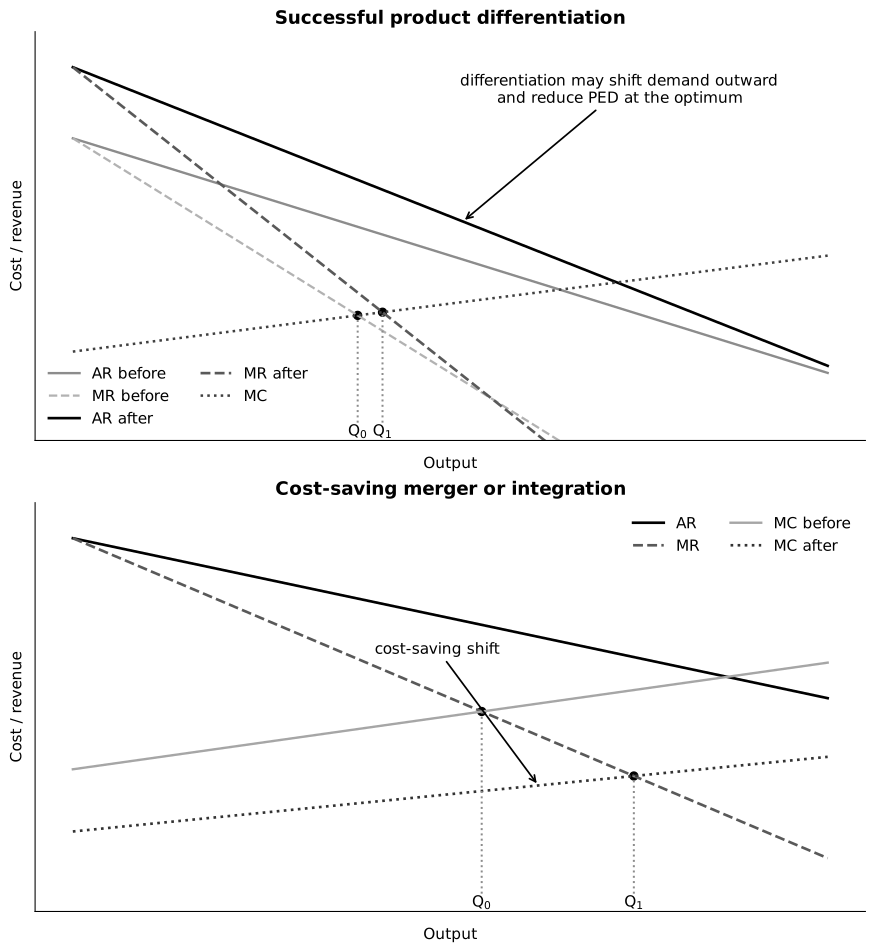
Caption: The upper panel shows the intended demand-side mechanism: successful differentiation may shift AR outward and make it less elastic, with a corresponding MR curve, but the new profit-maximising price and output depend on cost and rival response. The lower panel isolates a cost-side mechanism: a genuinely cost-saving merger shifts MC downward and can increase output, yet lower cost reaches consumers only if the firm passes some saving through. Both diagrams are conditional examples, not guaranteed effects of branding or merger.
Product differentiation can raise quality and variety but also strengthen brand barriers. Mergers may produce scale or scope economies, yet reduced rivalry can later raise price or weaken cost discipline.
Consumer cognitive biases in firm strategy
The syllabus requires awareness of three examples:
| Bias | Meaning | Possible firm application | Consumer-welfare concern |
|---|---|---|---|
| Sunk-cost fallacy | giving irrecoverable past cost weight in a current decision | subscriptions, loyalty progress or prepaid bundles may make switching feel wasteful | consumers may remain with a lower-value option even though past spending should not affect the present choice |
| Loss aversion | losses feel more important than equal-sized gains | framing a missed discount or loss of benefits as the reference point | framing can distort comparison and pressure purchase |
| Salience bias | prominent information is overweighted relative to less noticeable information | highlighting a headline discount, monthly instalment or selected product attribute | less visible total cost, risk or limitation may be underweighted |
Do not merely name the bias. Explain the design choice, how it changes attention or perceived payoff, the intended effect on demand or switching, and any ethical, reputational or regulatory constraint.
Technological, social and environmental considerations
Technological disruption can lower production or distribution cost, create new substitutes, make assets obsolete, or generate data and network advantages. A firm may respond through R&D, retraining, acquisition, platform investment, cost restructuring or exit. The result may increase contestability or strengthen concentration depending on who controls the technology and complementary assets.
Social and environmental concerns may affect decisions through consumer preferences, worker recruitment, investor requirements, regulation, supply-chain resilience and long-run reputation. Measures such as cleaner production, safer work, recyclable design or transparent sourcing can raise short-run cost but reduce risk, build demand or lower future cost. Claims should be evaluated for credibility and the possibility of greenwashing.
Third-degree price discrimination
Syllabus boundary
Third-degree price discrimination is required, but its diagrammatic analysis is not. The figure is retained as enrichment; the core task is to explain the conditions, mechanism and effects.
Conditions:
- market power;
- separable consumer groups;
- different demand elasticities;
- prevention of resale.
The elasticity condition determines the mark-up. Where demand is less price-elastic at the chosen output, a given price increase loses proportionately fewer sales, so the profit-maximising mark-up over MC is larger. Separation and prevention of resale are essential; otherwise buyers in the low-price group could resell to the high-price group and undermine the price difference.
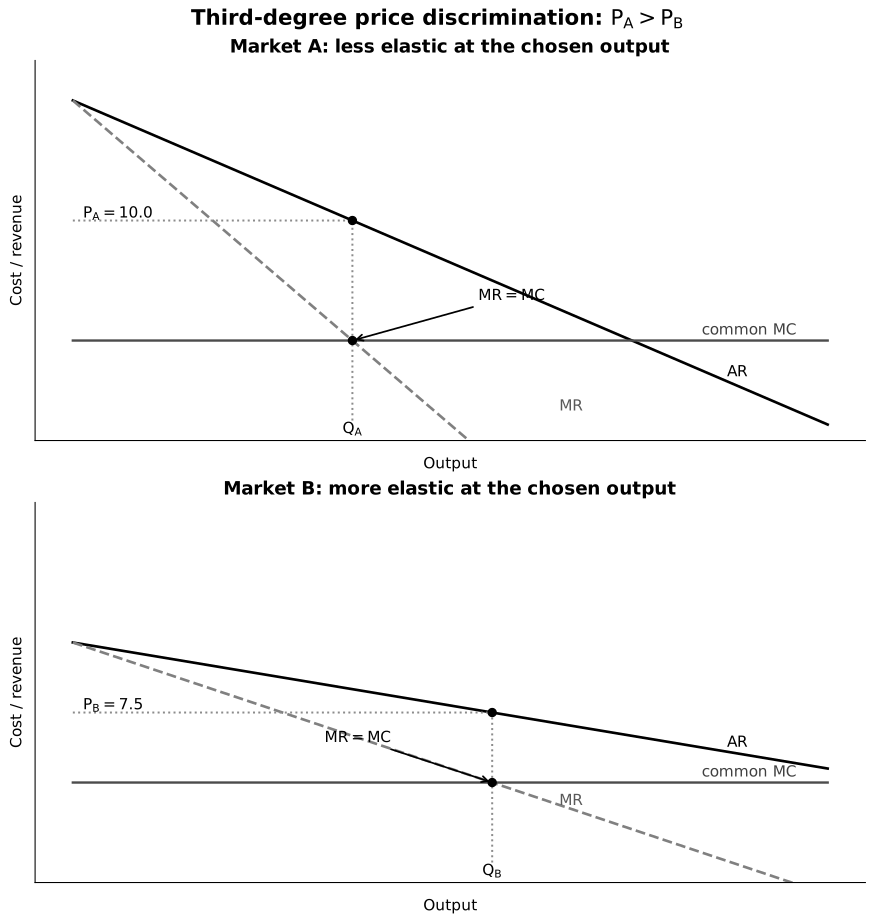
Caption: The firm separates two markets and allocates output so each market’s MR equals the common MC. Market A is less price-elastic at its chosen output, so it receives the higher price and larger mark-up; Market B is more elastic and receives the lower . The panels do not imply that the steeper-looking curve is always less elastic everywhere—elasticity must be assessed at the selected points.
Compared with uniform pricing, price discrimination can transfer consumer surplus to the firm, but may also expand total output or finance services that otherwise would not be supplied. Neither effect is guaranteed in every market.
Students should therefore separate distribution from efficiency. Charging some buyers more transfers surplus if their purchases continue. Serving an additional low-price group can increase output and reduce an otherwise forgone-benefit loss. If total output does not rise, redistribution toward the firm is more likely to dominate. The evidence needed is the comparison with the feasible uniform-price counterfactual.
Other forms are:
- First-degree discrimination: each unit is charged at the buyer’s maximum willingness to pay; this is largely a theoretical benchmark and transfers consumer surplus to the seller.
- Second-degree discrimination: the unit price varies with quantity or package chosen, such as block pricing; consumers self-select rather than being directly separated into observable groups.
First- and second-degree discrimination are useful anchor-note extensions. The named 9570 strategy is third-degree price discrimination, so prioritise that form for core revision.
Efficiency
- Allocative efficiency: , so the marginal valuation equals marginal opportunity cost.
- Productive efficiency: production at the lowest attainable average cost; on a given average-cost curve, this is its minimum point.
- Dynamic efficiency: innovation improves processes or products over time.
- X-inefficiency (enrichment): organisational slack raises cost above the attainable level.
These criteria answer different questions. asks whether society should have one more unit; minimum AC asks whether the chosen output is produced at the least attainable unit cost; dynamic efficiency asks whether products and production methods improve over time. A firm can satisfy one criterion and fail another.
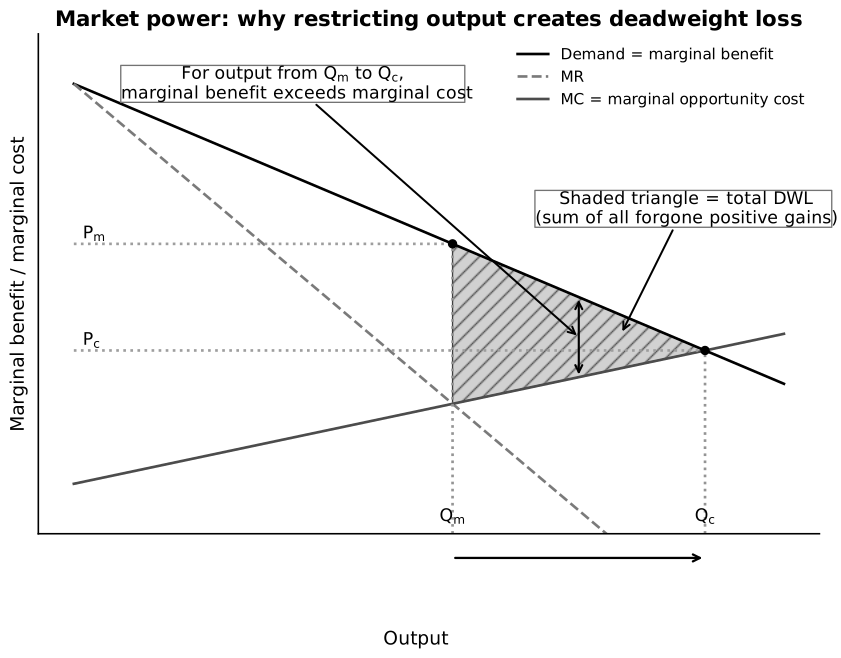
Caption: The competitive benchmark reaches where demand, interpreted as marginal benefit, meets MC, interpreted as marginal opportunity cost. The standard monopolist chooses where MR=MC and reads from demand. The price increase transfers part of consumer surplus to the firm, while the hatched area between demand and MC from to is the net social benefit of mutually beneficial units not produced—deadweight loss rather than profit.
Enrichment diagram
Diagrammatic comparison of market structures is not required. Use this figure to support the causal idea that market power may permit , not as a compulsory diagram template.
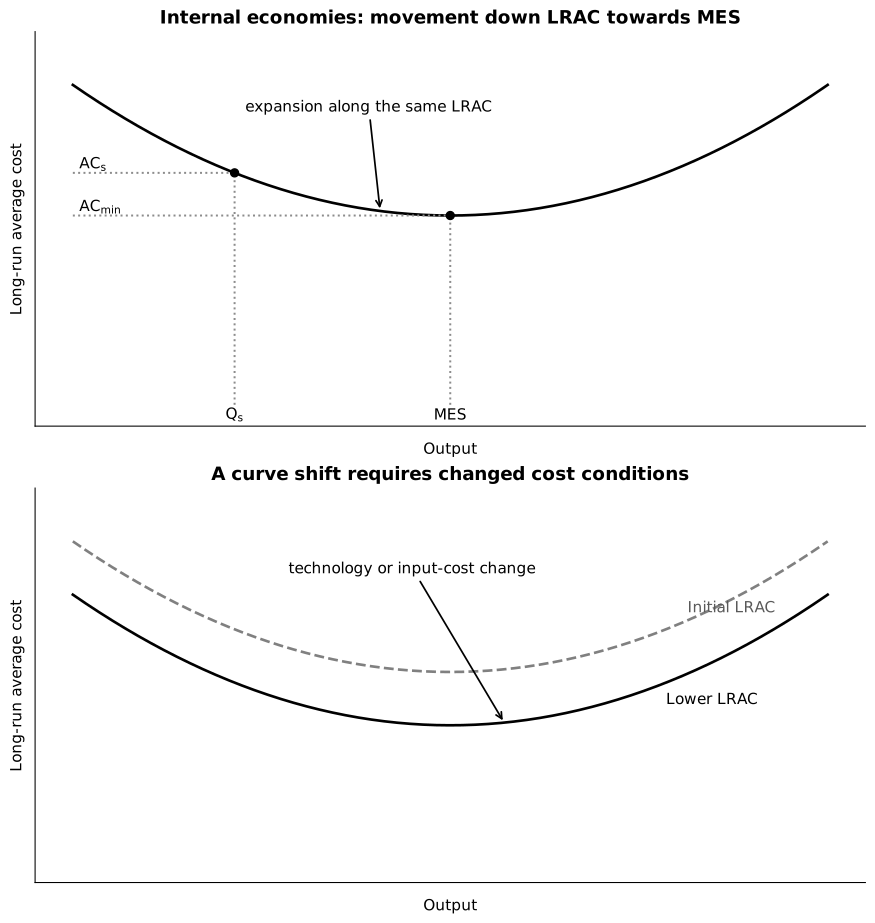
Caption: In the upper panel the firm expands along one unchanged LRAC from a higher-cost output toward MES; this is an internal scale movement. In the lower panel technology or input conditions shift the attainable LRAC downward at each output. Both can lower average cost, but only the first is “moving toward MES.” Productive-efficiency claims must specify the relevant attainable cost curve and output rather than treating every lower AC as the same mechanism.
Is monopoly always worse?
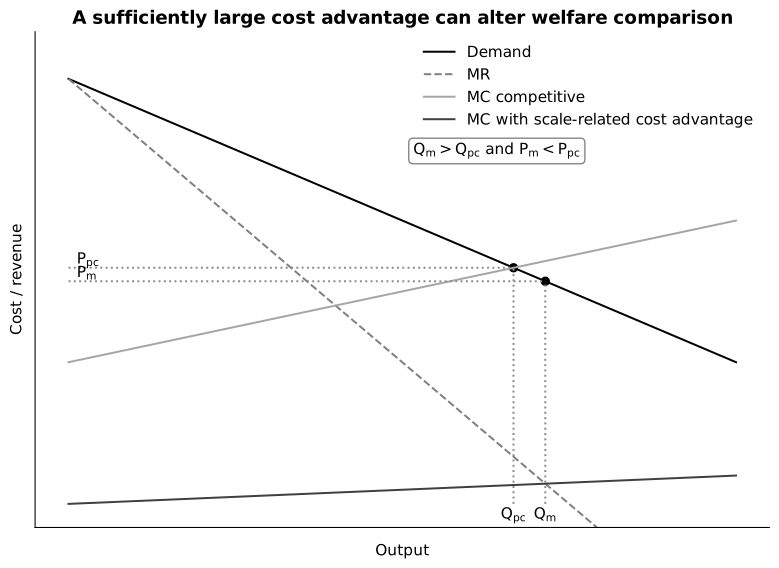
Caption: The competitive benchmark uses the higher marginal-cost schedule and produces where demand meets that MC. The monopoly has a sufficiently large scale-related cost advantage, so its own MR=MC choice can yield both greater output and lower price than the benchmark. This is a constructed conditional counterexample to “monopoly always charges more,” not a claim that market power normally guarantees lower price.
Potential benefits:
- scale economies;
- finance for R&D and network investment;
- standardisation and coordination;
- cross-subsidy of socially valuable services.
Potential costs:
- higher price and restricted output;
- weaker cost discipline;
- reduced choice or quality;
- inequitable transfer toward owners;
- strategic barriers to entry.
Impact matrix: firm, consumers and rivals
| Strategy | Possible firm effect | Possible consumer-welfare effect | Possible effect on other firms and efficiency |
|---|---|---|---|
| Price cut | market share and revenue may rise; margin falls | lower price, but quality may change | rivals lose demand and may respond; intense rivalry can improve allocative efficiency |
| Product differentiation/marketing | demand may shift right and become less elastic | more choice or information, but possibly persuasion and higher price | rivals’ revenue may fall; innovation may rise, while brand barriers may strengthen |
| R&D/process innovation | lower future cost or stronger demand, with risk of failure | better quality or lower price if gains are passed on | technological spillovers may lower rivals’ cost; patents may raise barriers; dynamic efficiency may improve |
| Merger/integration | scale or scope savings; greater bargaining power | price/quality may improve if savings dominate, or worsen if rivalry falls | suppliers and competitors may face lower revenue or higher access costs; productive efficiency may rise while allocative efficiency falls |
| Collusion | higher joint profit and lower uncertainty | usually higher price, lower output and less choice | non-members may gain demand or face exclusion; allocative efficiency usually worsens |
The word may matters. The net effect depends on PED, cost savings, entry conditions, rival responses, regulation and time.
Regulation
Enrichment bridge to Theme 2.3
Theme 2.2 requires evaluation of firm decisions and consumer welfare. Detailed government policy analysis belongs mainly to Theme 2.3, so this section is retained as a bridge rather than a complete policy chapter.
Policies include competition law, merger control, removal of barriers, price regulation, public ownership, taxes/subsidies and quality standards.
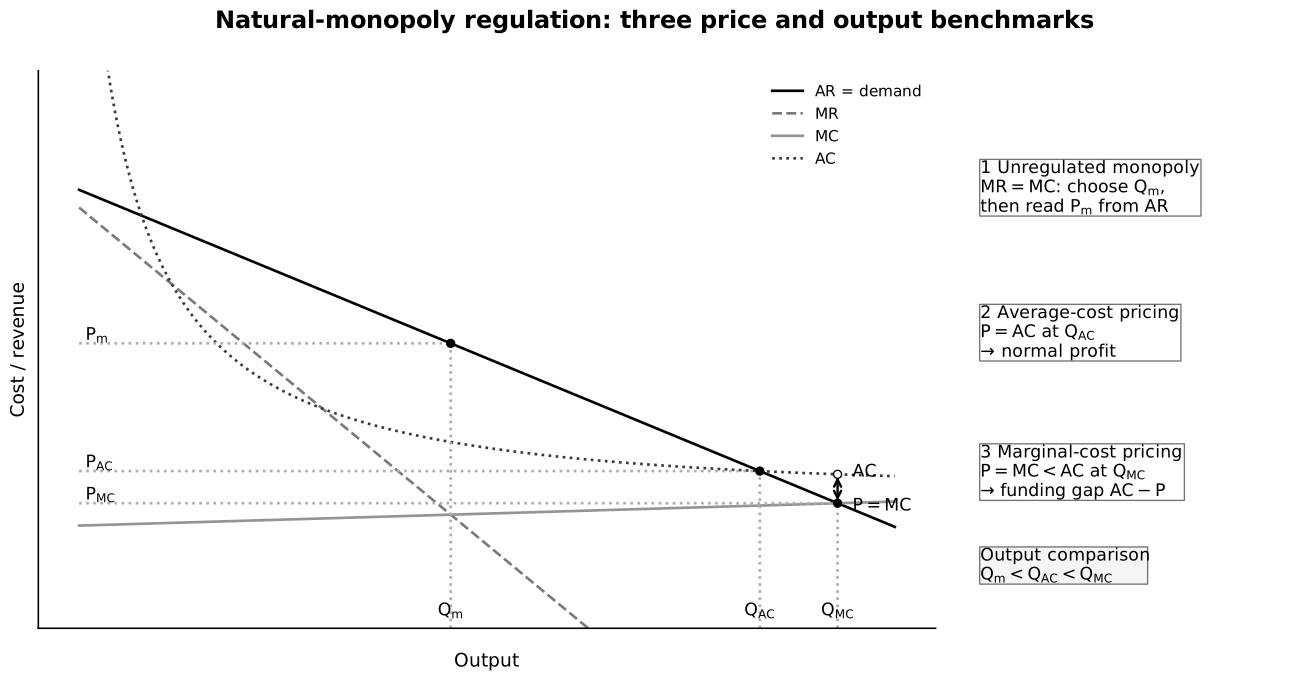
Caption: The unregulated monopoly chooses where MR=MC and charges from AR. Average-cost pricing expands output to where , allowing normal profit. Marginal-cost pricing expands further to where , but falling AC means there; the vertical AC−MC funding gap per unit must be financed if service is to continue. This enrichment diagram compares regulatory benchmarks, not guaranteed policy outcomes.
Regulation can fail through information gaps, regulatory capture, compliance cost, reduced innovation incentives and incorrect market definition.
Evaluation framework
- Identify the source of market power.
- Establish conduct and causal effect.
- Assess price, output, quality, variety and access.
- Compare static and dynamic efficiency.
- Consider scale economies and contestability.
- Evaluate policy feasibility and unintended effects.
- Give a conditional judgement.
A strong judgement identifies the dominant condition. For example, a merger is more likely to improve consumer welfare when cost savings are large, entry remains credible and rivalry still disciplines pass-through; it is more likely to harm consumers when barriers are high and the merged firm can retain savings while restricting output.
Common pitfalls
- Treating lower competition as proof of lower dynamic efficiency.
- Ignoring cost differences when comparing monopoly and competition.
- Claiming price discrimination always reduces output.
- Calling limit pricing and predatory pricing identical.
- Assuming product differentiation necessarily benefits consumers or that every merger lowers cost.
- Recommending more firms in a natural monopoly without cost analysis.
- Assuming regulation has complete cost and demand information.
- Listing a bias, technology or environmental concern without linking it to cost, demand, strategy or welfare.
- Treating a firm’s intended outcome as proof of the realised outcome.
Return to Firms and Decisions.