Economic Growth and Unemployment
What economic growth means
Economic growth is an increase in real national output. Two forms must be distinguished.
- Actual growth: equilibrium real national output rises. It can result from higher AD when spare capacity exists, or from higher AS.
- Potential growth: the economy’s productive capacity rises because the quantity, quality or productivity of factors of production improves.
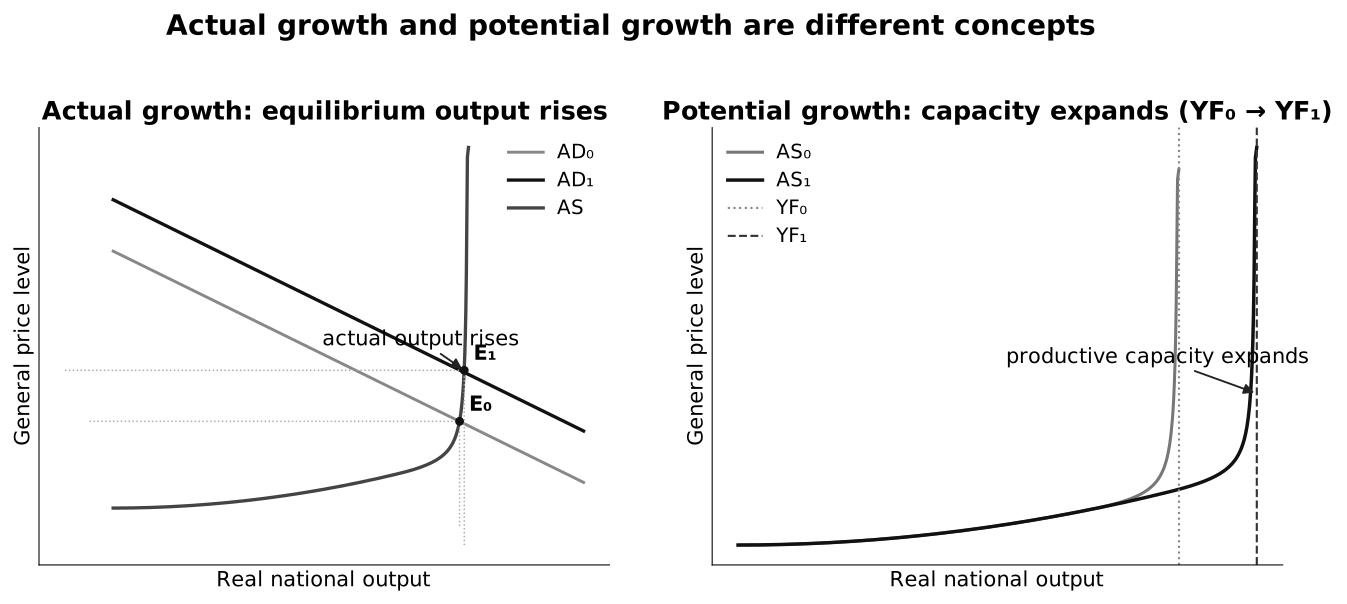
Caption: In the left panel, AS and the capacity boundary are unchanged while AD shifts right, so the new equilibrium has higher actual output. In the right panel, the full-capacity boundary moves from to , showing potential growth. The second change creates room to produce more; it does not guarantee that current AD will use the new capacity.
Actual growth without potential growth eventually meets capacity constraints and inflationary pressure. Potential growth without sufficient AD may leave the new capacity underused. Sustained growth therefore requires both supply capacity and expenditure sufficient to purchase the additional output.
| Concept | What changes? | What the AD-AS diagram must show |
|---|---|---|
| Actual growth | equilibrium real output | a new intersection farther right |
| Potential growth | maximum sustainable productive capacity | the capacity boundary or LRAS moves right |
| Negative output gap narrows | actual output moves closer to potential output | the horizontal distance to falls |
| Recession with hysteresis | current output falls and future capacity may later weaken | an initial AD/output contraction followed, if persistent, by slower capacity growth |
Causes of growth and contraction
Demand-side causes
A rise in , , or increases AD. With spare capacity:
The multiplier can amplify the initial autonomous change. Conversely, falling confidence, tighter policy, weaker foreign income or an adverse export shock can reduce AD and cause negative actual growth.
Supply-side causes
Potential growth can arise from:
- a larger labour force or capital stock;
- better education, training and health;
- improved infrastructure and institutions;
- innovation and technological progress;
- stronger competition, specialisation or resource mobility.
If productivity raises output per unit of input, unit costs may fall as capacity expands, supporting non-inflationary growth.
When growth is undesirable
The syllabus requires more than a simple “growth is good” claim.
- Persistently low or negative growth reduces income, employment, investment and tax revenue.
- Unsustainable growth may depend on excessive debt, non-renewable resource depletion, pollution or AD repeatedly exceeding capacity.
- Non-inclusive growth may leave groups without access to jobs, skills or rising real income.
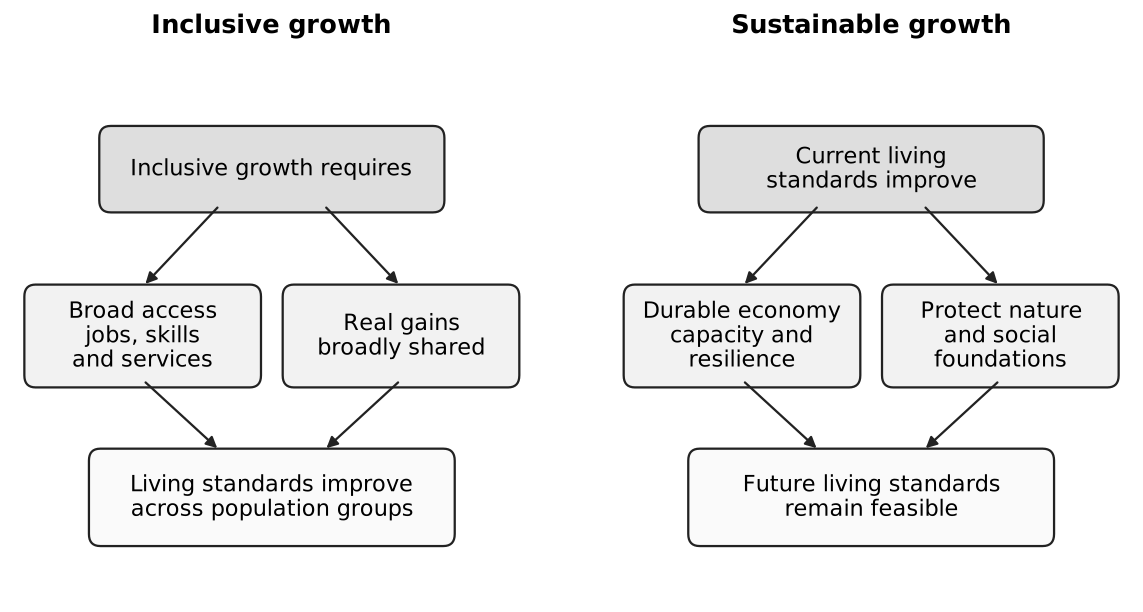
Caption: Desirable growth should be durable, environmentally sustainable and sufficiently inclusive to improve living standards broadly.
Benefits and costs of growth
Potential benefits include:
- higher household income and consumption possibilities;
- more employment and reduced demand-deficient unemployment;
- higher profits and investment incentives;
- a larger tax base, allowing improved public services or fiscal resilience;
- easier redistribution because gains can be shared without reducing everyone’s absolute income;
- improved international confidence and capacity to service debt.
Possible costs or qualifications include:
- demand-pull inflation when actual output approaches capacity;
- higher imports and a weaker balance of trade;
- congestion, pollution and depletion of natural capital;
- structural unemployment when technology changes job requirements;
- wider income inequality if gains accrue mainly to scarce skills or capital owners;
- an opportunity cost when current consumption is reduced to finance investment.
The overall living-standard effect depends on the source, distribution and sustainability of growth.
Business cycle and output gaps
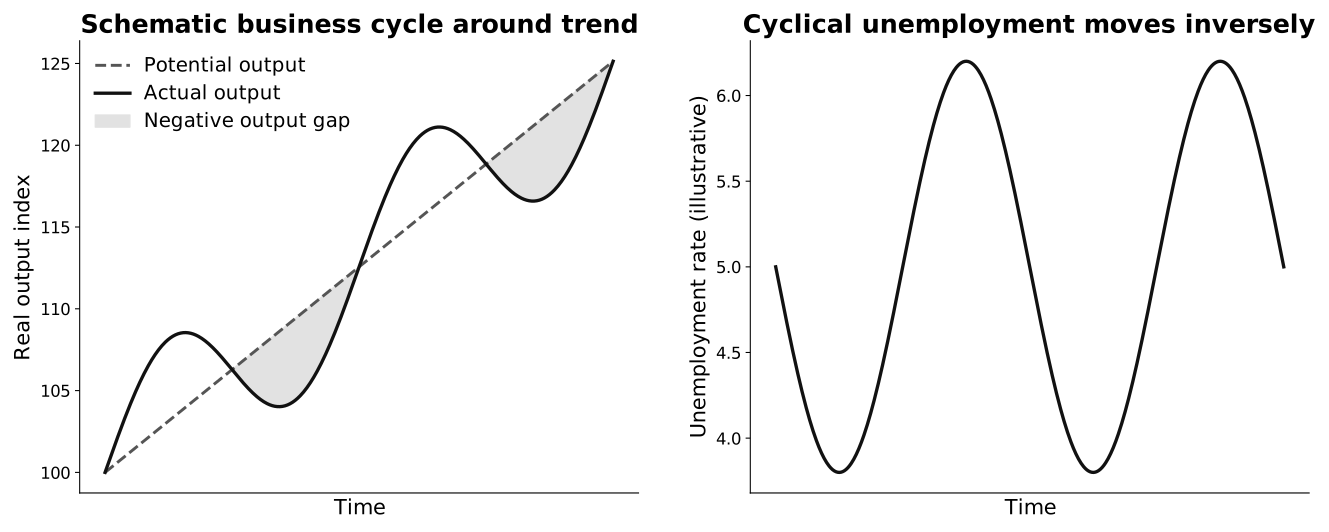
Caption: The left panel compares actual output with a smoother potential-output path. Shaded intervals show negative output gaps, not a physical loss of all productive capacity. The right panel moves inversely because weak sales reduce firms’ derived demand for labour. The curves are schematic and do not claim a fixed numerical relationship.
A negative output gap occurs when actual output is below potential output. A positive output gap occurs when demand pushes output beyond its sustainable level, commonly creating bottlenecks and inflationary pressure.
Short-run fluctuations need not change the growth of productive capacity. A prolonged downturn, however, can reduce investment and weaken skills, lowering future potential output.
Full employment and unemployment measurement
The labour force consists of employed people plus those who are without work, available for work and actively seeking work under the statistical definition.
Full employment does not mean zero unemployment. It means demand-deficient unemployment is absent; frictional and structural unemployment can remain.
The headline rate has limitations:
- discouraged workers who stop searching are excluded from unemployment and the labour force;
- underemployment is not fully captured;
- a fall in participation can reduce the rate without improving job opportunities;
- aggregate data conceal age, skill, sectoral and regional differences.
Cross-check participation, employment, hours, vacancies, duration of unemployment and real wage changes.
Do not read one labour-market rate alone
| Measure | Definition | What it can reveal |
|---|---|---|
| Labour-force participation rate | labour force as a share of the relevant working-age population | whether people are entering or leaving active work/search |
| Unemployment rate | unemployed active jobseekers as a share of the labour force | measured inability to find work among active participants |
| Employment-to-population ratio | employed people as a share of the relevant population | whether employment itself is rising rather than the unemployment rate falling through exit |
| Underemployment | employed workers wanting or available for more suitable hours or work | labour underuse hidden by the employed/unemployed boundary |
Labour demand is derived demand: firms hire workers because labour helps produce output that they expect to sell. A fall in product demand can therefore reduce employment even if workers’ skills and willingness to work have not changed.
Types, causes and mechanisms
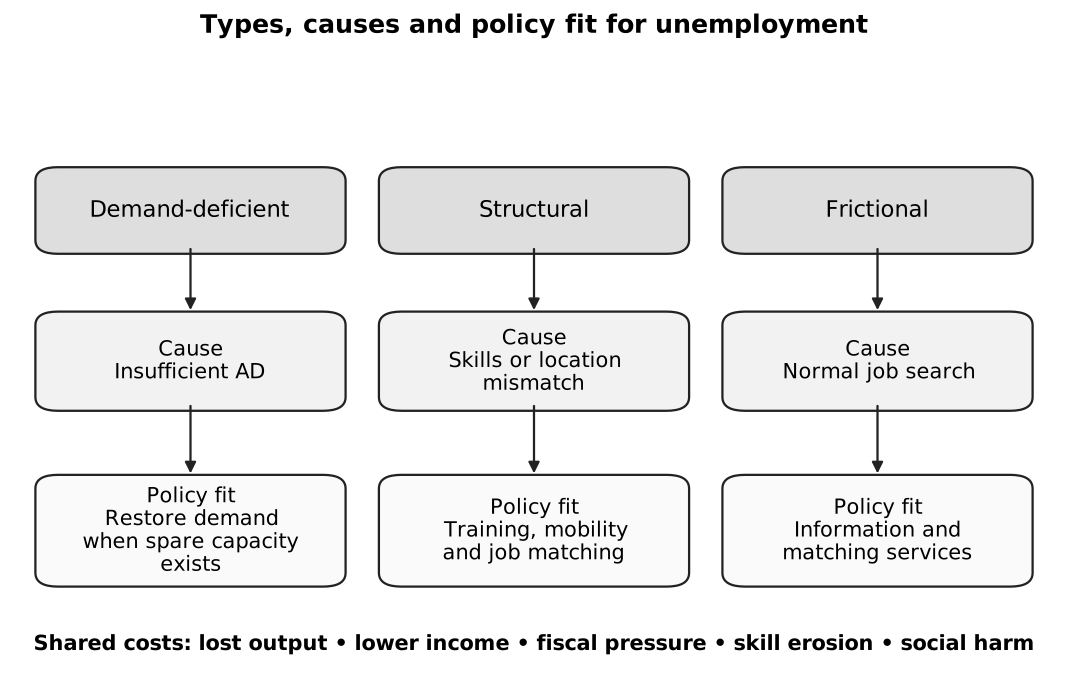
Caption: Read each column from diagnosis to policy fit. Insufficient AD calls for demand support when spare capacity exists; mismatch calls for skills, mobility or matching measures; ordinary job search calls for better information and matching. The shared-cost strip does not mean every type has the same severity or should be eliminated completely.
Demand-deficient unemployment
Weak AD reduces firms’ sales. Unplanned inventories rise, so firms cut production and derived demand for labour. The resulting fall in income can cause further reductions in consumption through the multiplier.
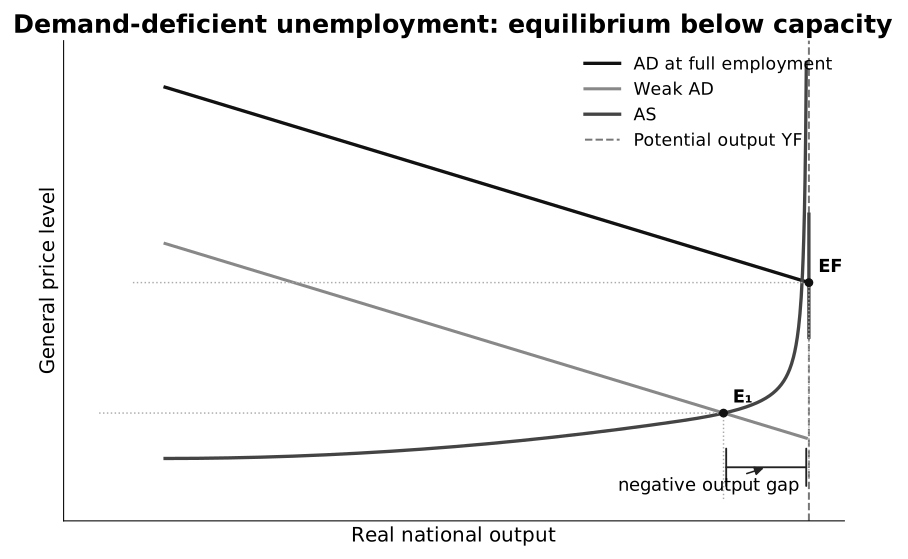
Caption: Weak AD intersects AS at , to the left of potential output , creating a negative output gap and demand-deficient unemployment. A stronger AD schedule reaches at . The diagram isolates demand deficiency: expansion would be inappropriate if unemployment instead arose mainly from structural mismatch near capacity.
Diagnose unemployment before naming a policy
- Check whether real output is below potential output and whether vacancies have fallen broadly.
- Compare unemployment across occupations, skills, sectors and locations.
- Check participation, duration, underemployment and vacancy data.
- Decide whether the dominant problem is demand deficiency, mismatch, search or a combination.
- Match the policy and time horizon to that diagnosis, then test inflation, fiscal and implementation constraints.
Structural unemployment
Structural unemployment occurs when the location, occupation or skills of workers do not match available vacancies. Causes include technological change, changing consumer demand, trade patterns, relocation of production and long-lasting regional decline.
Even if vacancies exist, workers may not move or retrain quickly because of cost, information gaps, family commitments or qualification barriers.
Frictional unemployment
Frictional unemployment arises while workers enter the labour force or move between jobs. Some frictional unemployment can improve matching by giving workers and firms time to find more suitable employment.
Enrichment: natural rate and hysteresis
The natural rate of unemployment is commonly described as frictional plus structural unemployment when demand-deficient unemployment is absent. A prolonged recession may cause hysteresis: skill loss, discouragement and weaker attachment to work can turn cyclical unemployment into a more persistent structural problem.
Consequences of unemployment
Individuals and households
- lost income and consumption;
- depreciation of skills and employability;
- stress, poorer health and reduced social participation;
- greater inequality and risk of poverty.
Firms
- weaker demand and profits during cyclical unemployment;
- a larger available labour pool and weaker wage pressure;
- loss of human capital and consumer confidence if unemployment persists.
Government and society
- lost real output and tax revenue;
- higher transfer payments and possible budget deterioration;
- greater inequality, social exclusion and fiscal pressure;
- possible social and regional instability.
Very low unemployment can also create recruitment difficulty, wage pressure and production bottlenecks, especially when unemployment is mainly structural rather than cyclical.
Matching policy to the cause
| Diagnosis | Appropriate direction | Why | Main limitation |
|---|---|---|---|
| Demand deficiency | Expansionary fiscal or monetary policy | Raises AD and derived demand for labour | Inflation/import leakage near capacity; weak confidence may reduce transmission |
| Skills mismatch | Education, retraining, employer-linked programmes | Raises occupational mobility and employability | Time lag; training may not match future vacancies |
| Geographical mismatch | Transport, housing, relocation support, regional development | Raises geographical mobility | High fiscal cost and social reluctance to move |
| Frictional unemployment | Better vacancy information and matching services | Shortens search time | Excessive pressure to accept unsuitable jobs may worsen matching |
Demand expansion alone can create inflation if unemployment is mainly structural. Supply-side measures alone may not create vacancies during severe demand weakness. A mixed diagnosis therefore supports a policy package.
Evaluation framework
Assess:
- the type and scale of unemployment;
- the output gap and AS range;
- whether vacancies exist;
- confidence, credit and multiplier leakages;
- time lags and implementation quality;
- distributional and fiscal effects;
- whether short-run support prevents hysteresis while longer-run measures improve matching.
Common pitfalls
- Calling all unemployment demand-deficient.
- Treating full employment as zero unemployment.
- Confusing actual growth with potential growth.
- Assuming a fall in the unemployment rate must mean more people found jobs.
- Recommending training as the sole response to a collapse in AD.
- Claiming all technological change permanently raises unemployment.
- Judging growth without considering inclusion and sustainability.
Return to Macroeconomic Objectives and Policies.