Measuring Performance and Living Standards
What standard of living means
Standard of living refers to material and non-material well-being.
- Material well-being concerns access to goods and services and the real purchasing power needed to obtain them.
- Non-material well-being includes health, education, leisure, security, social relationships, environmental quality and personal freedoms.
Because living standards are multidimensional, a responsible comparison uses a dashboard of indicators rather than one headline number.
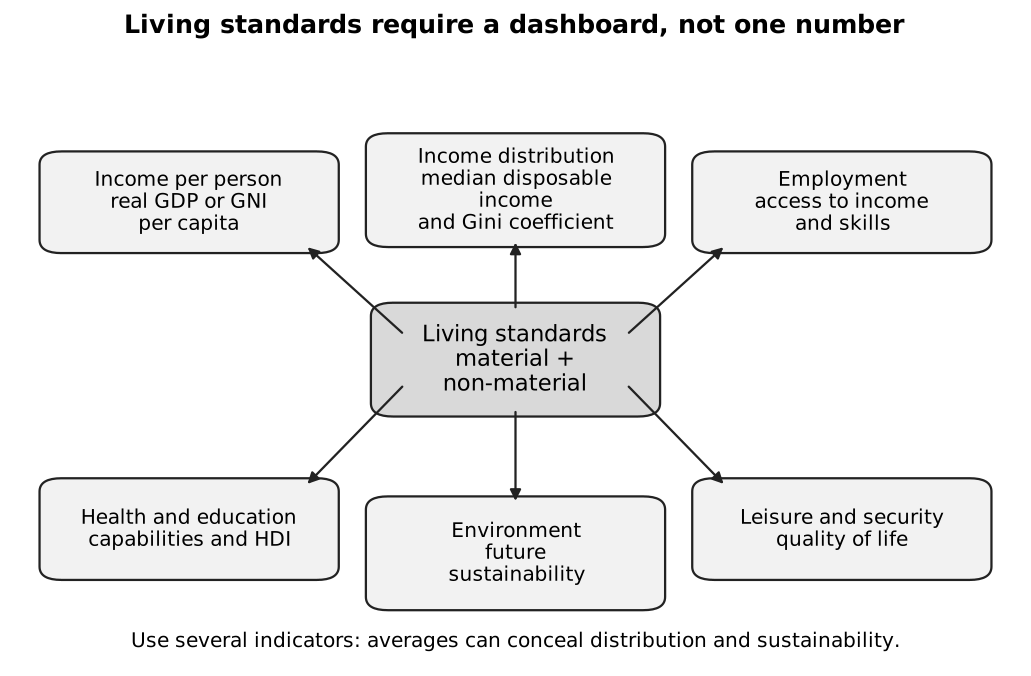
Caption: Read the centre as the concept being assessed and the outer boxes as complementary evidence. Real income per person informs average material purchasing power; distribution, health, education, employment, leisure, security and environmental quality test whether the gains are broad and sustainable. These indicators are not interchangeable or mechanically added together.
Choose the indicator from the question
| Question being asked | Start with | Then qualify using |
|---|---|---|
| Has market production increased over time? | real GDP growth | population, composition and sustainability |
| Has average material purchasing power improved? | real GDP or GNI per capita | distribution, public services and PPP where relevant |
| Are residents receiving the income generated? | GNI relative to GDP | net primary income flows and population |
| Are human capabilities improving? | HDI and its dimensions | inequality, service quality and omitted dimensions |
| Is income distributed more equally? | Lorenz curve, Gini and median income | absolute income levels, taxes/transfers and data definition |
| Is short-run macroeconomic performance improving? | growth, unemployment, inflation and trade indicators | the cause, business-cycle position and more than one year of data |
GDP, GNI and the adjustments that matter
Gross Domestic Product (GDP) is the value of final goods and services produced within an economy over a period. Gross National Income (GNI) measures income received by residents and adjusts GDP for net primary income from abroad.
Four distinctions prevent common errors:
- Nominal versus real: nominal values use current prices; real values remove the effect of general price changes.
- Total versus per capita: a larger economy may produce more while output per person falls.
- Domestic versus national: GDP follows location of production; GNI follows income accruing to residents.
- Market exchange rate versus purchasing power parity (PPP): converting at market rates does not fully account for different price levels, especially for non-traded services.
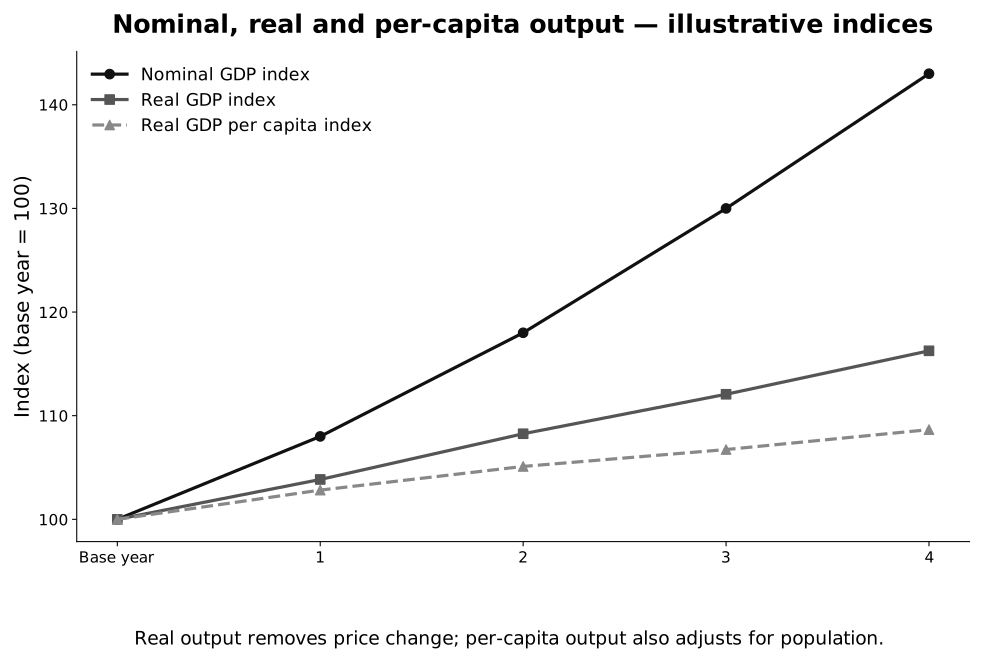
Caption: The three lines begin from the same base-year index. Nominal GDP rises with both prices and quantities; the real-GDP line removes the price-level change; the real-per-capita line also divides by population. The vertical gaps are adjustments to the same output series, not three independent measures of welfare.
Where a GDP deflator uses base-year index :
The syllabus requires understanding rather than calculation of national income. The formula and example below are supporting enrichment: they help explain why nominal growth can overstate the change in real output, but they are not a required national-income calculation procedure.
GDP and GNI are flows per period. A CPI or GDP-deflator observation is an index level, while inflation is the percentage rate of change of a price index. Public debt and a capital stock are stocks measured at a point in time. Mixing a stock with a flow, or an index level with its growth rate, produces misleading comparisons.
Enrichment: worked numerical interpretation
Suppose nominal GDP rises from $500 billion to $540 billion while the GDP deflator rises from to .
Nominal GDP grew by , but real GDP grew by only about . If population grew by , real GDP per capita fell slightly. It would therefore be unsafe to claim that average material living standards improved.
Why real GDP or GNI per capita remains incomplete
Even after inflation and population adjustments, the measure has limitations:
- it is a mean, so it can rise while the median household or lower-income groups gain little;
- it omits unpaid household and volunteer work;
- informal or subsistence activity may be under-recorded;
- defensive expenditure after pollution, congestion or crime raises measured output without necessarily raising welfare;
- quality improvements and new products are difficult to value;
- it says little about leisure, job security, health or education;
- current output may be achieved by depleting natural or produced capital, reducing future well-being.
Do not conclude that GDP is useless. It is a broad, regularly measured indicator of market production and taxable capacity. The correct response is to combine it with other evidence.
Index numbers and CPI
An index number expresses a value relative to a base year, usually set equal to . A CPI is a weighted index of prices in a representative household consumption basket.
- A larger expenditure weight gives a category more influence on the CPI.
- CPI means that the basket’s measured price level is above the base-year level; it does not mean prices rose in the latest year.
- The inflation rate compares the CPI across two periods:
CPI may differ from an individual’s cost of living because households have different baskets. Substitution, quality change, new goods and changing retail outlets can also reduce accuracy.
CPI and the GDP deflator answer different questions
| Measure | Coverage | Main use |
|---|---|---|
| CPI | a weighted basket of consumer goods and services purchased by households, including relevant imports | consumer-price inflation and household purchasing power |
| GDP deflator | prices of domestically produced final output included in GDP; composition changes with current production | separating nominal GDP change into price and real-output components |
Neither measure is universally “better”. Choose according to whether the question concerns consumer prices or the price of domestically produced output.
Human Development Index
The Human Development Index (HDI) is a composite indicator of average achievement in three dimensions:
- a long and healthy life, represented by life expectancy at birth;
- knowledge, represented by expected and mean years of schooling;
- a decent material standard of living, represented by GNI per capita adjusted for purchasing power.
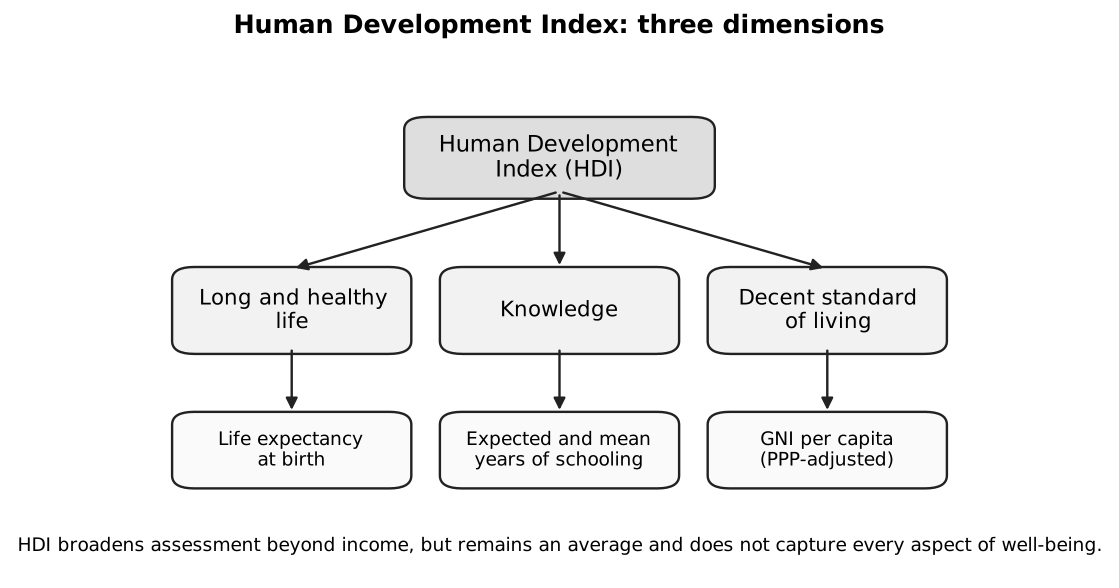
Caption: Follow the three branches from HDI to their indicators: life expectancy for health, expected and mean years of schooling for education, and PPP-adjusted GNI per capita for material resources. Combining dimensions broadens comparison beyond GDP, but the resulting average still conceals within-country inequality and omitted aspects of well-being.
HDI is useful because two economies with similar real GNI per capita can differ substantially in health and education. However, an average HDI can conceal inequality, regional gaps, environmental damage, political freedoms and the quality of services. The syllabus requires interpretation, not calculation, of HDI.
Lorenz curve and Gini coefficient
The Lorenz curve plots cumulative population shares, ordered from lowest to highest income, against cumulative income shares.
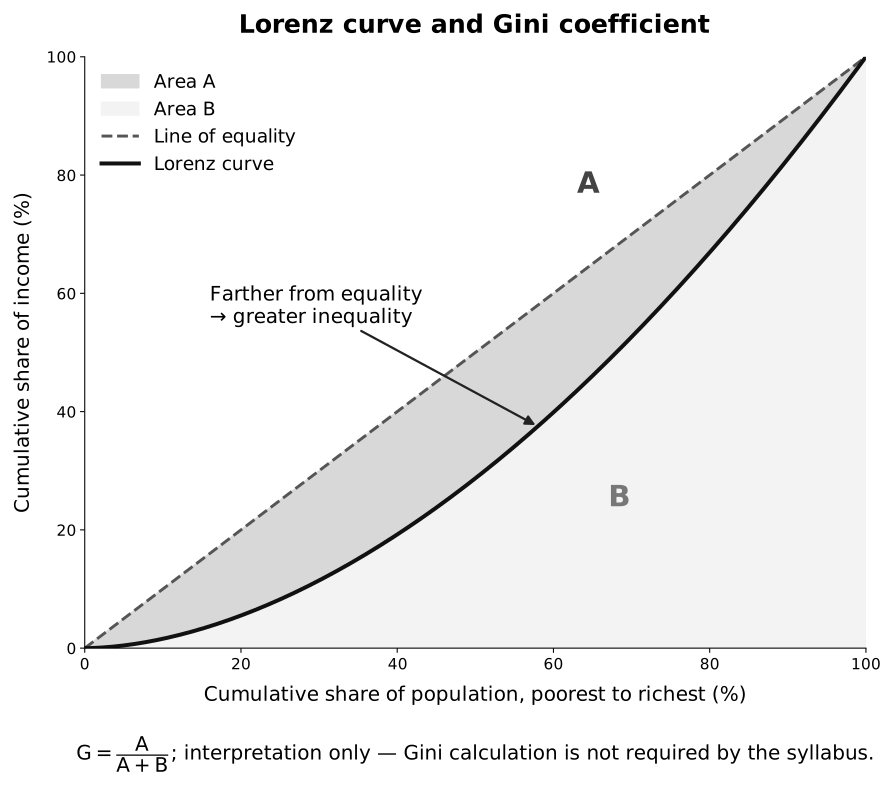
Caption: Read both axes cumulatively from the poorest households. The diagonal is perfect equality; the Lorenz curve shows the actual cumulative income share. Area is the gap from equality and is the whole triangle below the equality line, so . A larger gap indicates greater relative inequality, not necessarily lower absolute income.
The Gini coefficient compares the area between the line of equality and the Lorenz curve with the entire area beneath the equality line:
- represents perfect equality.
- A value closer to represents greater inequality.
- A lower Gini indicates a more equal relative distribution, not necessarily higher incomes or less poverty.
The syllabus requires interpretation of the Lorenz curve and the -to- scale, not calculation of the Gini coefficient.
Lorenz curves can cross, making an unqualified visual ranking difficult. Gini values also depend on the income definition, household adjustment, treatment of taxes and transfers, and data quality.
Employment and external indicators
The unemployment rate is:
It can understate labour-market slack because discouraged workers are outside the labour force and underemployment is not captured fully. Cross-check labour-force participation, hours, vacancies and long-term unemployment.
The balance of trade is also an indicator of performance, but it must be interpreted with the business cycle, competitiveness, import composition and wider balance-of-payments financing. A deficit generated by productive capital imports differs from one driven by persistent loss of competitiveness.
Comparing living standards over time
Use:
- real rather than nominal measures;
- per-capita rather than total measures where population changes;
- consistent definitions and base years;
- distributional, health, education and environmental evidence;
- several years of data rather than one observation.
Measurement may improve over time, and the quality or range of goods can change. A statistically measured rise need not be experienced equally by all groups.
Comparing living standards across economies
Use PPP-adjusted real income where possible and compare similar years. Then consider:
- different population age structures and household sizes;
- income distribution and poverty;
- public provision of health and education;
- working hours, leisure and job security;
- climate, congestion, pollution and safety;
- informal production and data reliability.
An economy with lower measured income may provide more public services or leisure; one with higher income may have greater inequality or environmental costs.
Inclusive and sustainable performance
Inclusive growth expands opportunities and allows gains to be shared broadly through employment, capabilities and income. Sustainable growth improves present living standards without undermining the productive, social and environmental foundations of future living standards.
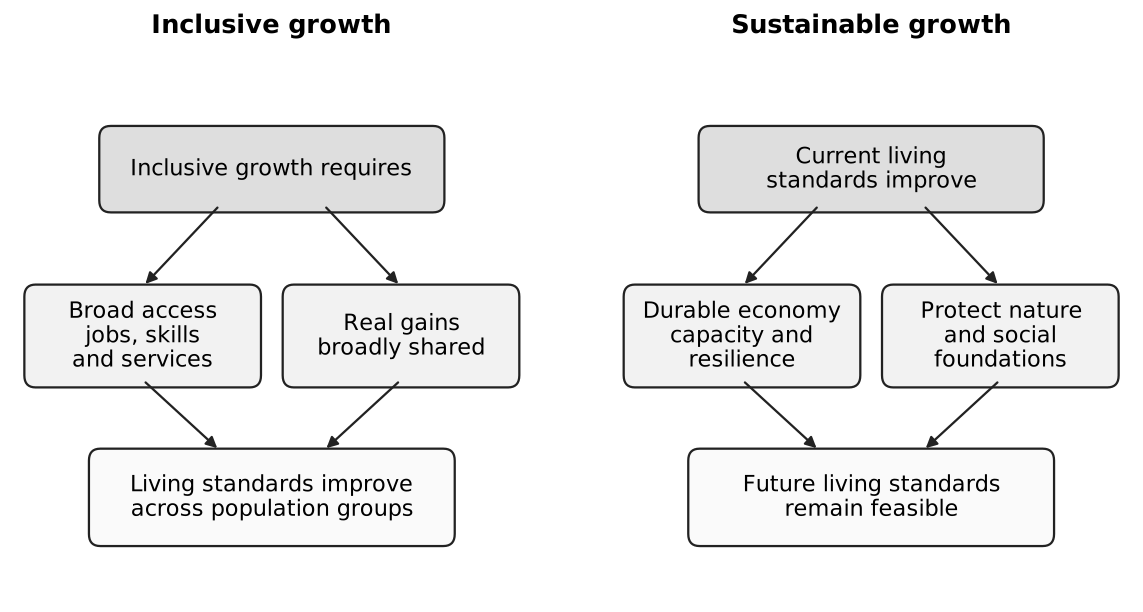
Caption: The left branch asks whether access to jobs, skills and real gains is broad; the right branch asks whether economic, environmental and social foundations remain viable for the future. Growth can satisfy one branch without satisfying the other, so “inclusive” and “sustainable” should be evaluated separately before reaching an overall judgement.
Common pitfalls
- Comparing nominal GDP across years without allowing for inflation.
- Using total GDP to compare economies with very different populations.
- Treating GDP per capita as the income received by every household.
- Describing CPI as a current inflation rate of .
- Saying HDI measures every dimension of welfare.
- Saying a Gini coefficient of means of income is unequal.
- Inferring living standards from one indicator without qualification.
Exam-ready judgement
A strong judgement names the comparison being made, selects appropriate indicators, explains what each captures, and then identifies what remains unmeasured. The best indicator set depends on whether the question concerns material purchasing power, inequality, human capability, short-run stability or long-run sustainability.
Return to Macroeconomic Objectives and Policies.