Equity, Income Distribution and Redistribution
Core Theme 2.3 focus: equitable access
Equity concerns fairness in the distribution of resources and access to essential goods and services. What counts as fair depends on value judgements, so equity cannot be determined by an efficiency diagram alone.
Equity is not the same as equality. Equality gives people the same amount or treatment; equity may justify different support according to need, disadvantage, contribution or ability to pay. A rigorous answer identifies the chosen fairness principle and the affected group.
An efficient market outcome need not be equitable. Markets allocate using dollar votes: wants backed by greater ability to pay exert more influence over production. Households with low income may therefore lack adequate access to healthcare, education, housing, food, transport or basic utilities even when the market allocation is allocatively efficient.
Access is more than formal availability. A service may exist yet remain inaccessible because of price, distance, waiting time, information, eligibility rules, disability, language or poor quality. Evaluation should therefore ask whether the intended household can actually obtain and use an adequate service.
Classification
Inequity is a distributional concern, not a form of market failure. A question may ask government to pursue both efficiency and equity, but the two objectives should be analysed separately.
Concepts of fairness
- Horizontal equity: people in relevantly similar circumstances are treated similarly.
- Vertical equity: people with different ability to pay or different needs may be treated differently.
- Equality of opportunity: access to education, healthcare and other foundations should not depend excessively on circumstances of birth.
These concepts are helpful enrichment; an answer should state the relevant meaning of fairness rather than assume universal agreement.
Policies to improve access
Targeted subsidies and vouchers
A subsidy lowers the effective price of an essential good. A voucher restricts support to a stated use and may preserve provider choice. Both can improve affordability, but inaccurate targeting, fraud, supplier price increases and benefits received by households that would have purchased anyway can reduce effectiveness.
Trace the mechanism: lower effective price → greater ability and incentive to consume → higher take-up and access, provided supply can expand. If supply is highly inelastic, part of the subsidy may instead raise provider prices or lengthen queues.
Direct and joint provision
With direct provision, government finances and arranges a service to guarantee a baseline level of access. With joint provision, public and private providers coexist, so government supplements market provision while allowing private choice. Evaluation should consider quality, capacity, waiting time, fiscal opportunity cost and whether the public provision is used by the intended group.
Direct provision does not require every worker or facility to be government-owned: government may contract production while retaining responsibility for financing and access. Joint provision is not the same as a one-off public-private project; it means public provision operates alongside a continuing private market.
Transfers and in-kind support
Cash transfers raise purchasing power and preserve choice. In-kind transfers ensure support is directed toward an essential good. Means testing can improve targeting but creates administrative cost, stigma, exclusion errors and potentially high effective marginal tax rates when benefits are withdrawn.
Price regulation and wage policy
Price ceilings may improve affordability for households that obtain the good, but can create shortages, queues, black markets and deterioration in quality. A wage floor can raise earnings for retained workers, but its employment effect depends on labour-market structure, compliance and elasticities.
Long-run opportunity
Education, healthcare, training, childcare, transport and housing access can reduce persistent disadvantage by expanding earning capacity and participation. These measures take time and depend on service quality and labour demand.
Evaluating equity policies
Ask:
- Who gains and who bears the cost?
- Is support targeted by income, need, location or use?
- Are eligible households aware of and able to claim it?
- Does the policy improve actual access, not merely formal eligibility?
- What happens to work, saving, prices, employment, quality and supply?
- Is short-run relief combined with long-run opportunity?
Cross-theme enrichment: income distribution
Syllabus boundary
Income inequality, Lorenz curves and Gini coefficients are mainly developed in Theme 3.2. They are retained here because they help connect distributional outcomes to microeconomic access, but they should not replace the Theme 2.3 analysis of essential goods and services.
Market incomes may differ because of ownership of assets, education and skills, productivity, bargaining power, discrimination, unemployment, illness, caregiving, technological change, trade and inheritance.
Lorenz curve and Gini coefficient
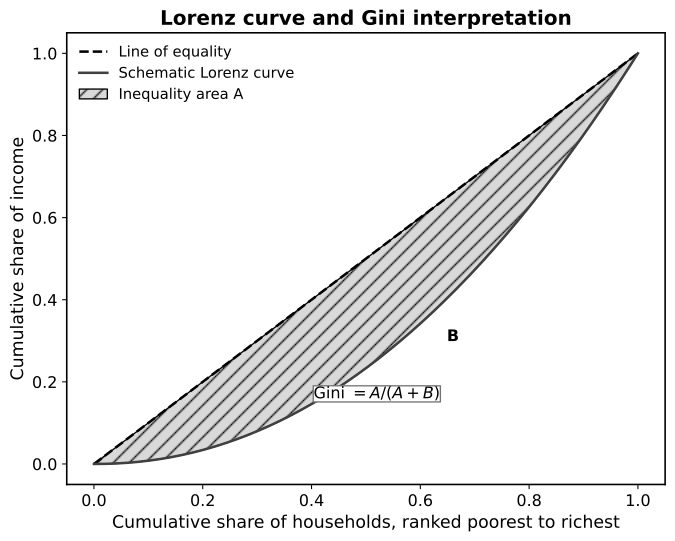
Caption: Rank households from poorest to richest. At each cumulative population share on the horizontal axis, the Lorenz curve gives the cumulative income share received by those households. The line of equality would give the bottom 40% exactly 40% of income. A curve farther below that line produces a larger area and a higher Gini coefficient, but it does not reveal absolute incomes or who moved within the distribution.
If is the area between the line of equality and the Lorenz curve, and is the remaining area beneath the Lorenz curve, then:
The Gini coefficient summarises relative income distribution. It does not reveal living standards, mobility, causes of inequality or where in the distribution a change occurred.
Because is the entire triangle under the line of equality, the ratio lies between zero and one in the usual representation. A value nearer zero indicates greater equality; a value nearer one indicates greater inequality. It is an index, not a percentage of people who are poor.
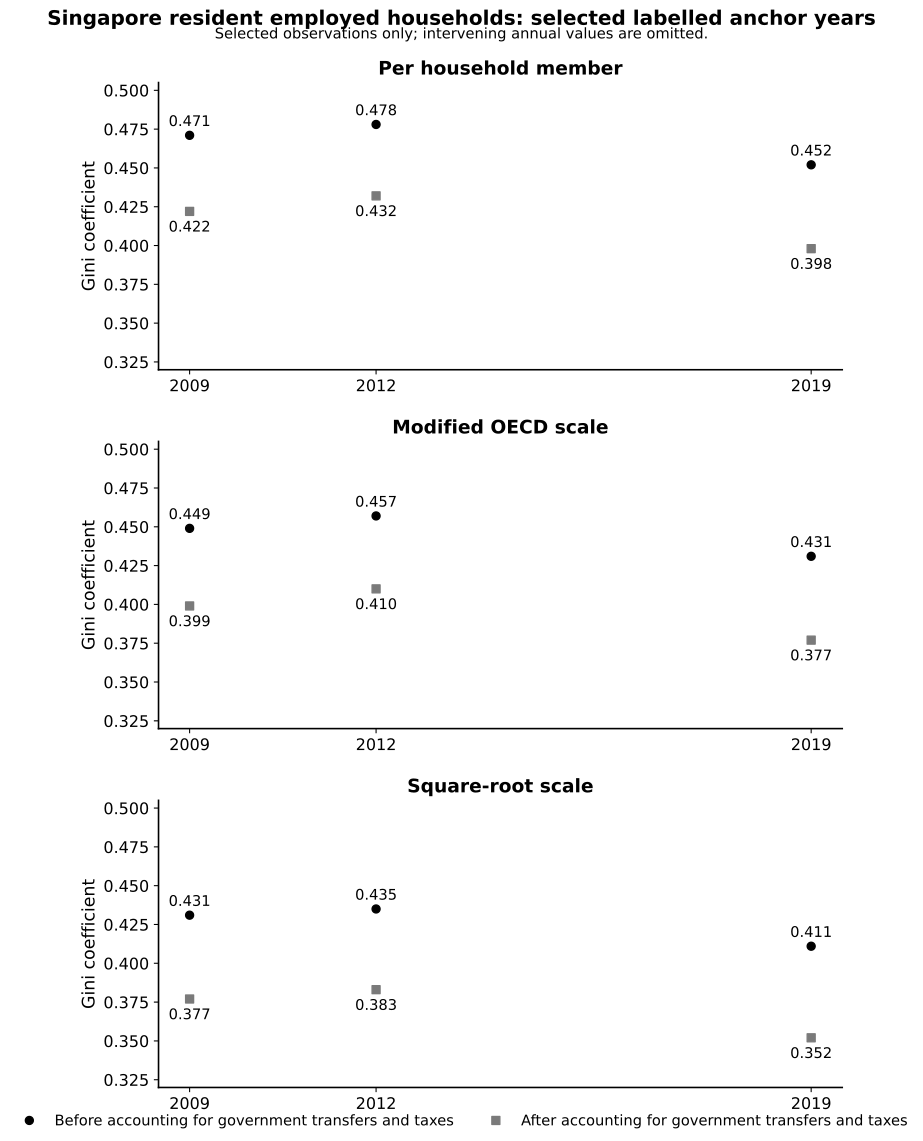
Caption: Selected historical values from the SAJC anchor show lower Gini coefficients after transfers and taxes under all three equivalence scales; they do not prove that every redistribution policy has the same effect.
Progressive taxes and transfers
A progressive tax takes a larger average proportion of income as income rises. Combined with transfers, it can raise disposable income and access to necessities, but high effective marginal tax rates may weaken work or saving incentives and public funds have an opportunity cost.
Wage floors
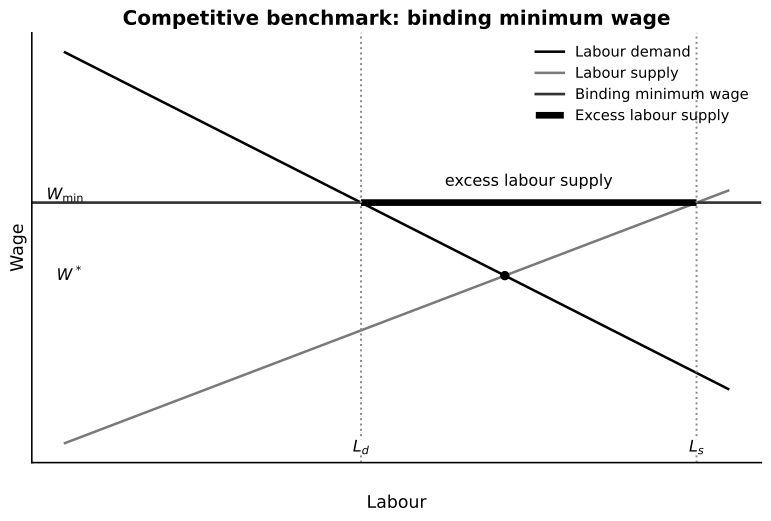
Caption: In the competitive benchmark, a binding minimum wage raises labour supplied to but reduces labour demanded to . The horizontal difference is excess labour supply, not the number employed; employment is constrained by labour demand at . This prediction is not universal: with monopsony power, a moderate wage floor can raise both wage and employment.
A wage floor may reduce working poverty and improve morale or productivity. It may also reduce employment, hours or training, raise prices, or accelerate automation. Distributional judgement must include workers who do not retain jobs.
Common pitfalls
- Calling inequity market failure.
- Assuming fairness has one uncontested definition.
- Treating a lower Gini as proof that everyone is richer.
- Judging a policy by eligibility rather than actual access and take-up.
- Ignoring shortages, quality, employment or fiscal opportunity cost.
- Presenting Theme 3.2 inequality measures as the whole of Theme 2.3 equity.
Return to Microeconomic Objectives and Policies.