Externalities and Corrective Policies
Meaning and marginal framework
An externality is an unpriced cost or benefit from production or consumption that affects a third party who is not directly involved in the market transaction.
“External” does not mean that the effect occurs outside the country or outside the industry. It means the affected person is outside the decision or transaction and receives no payment for a benefit or compensation for a cost.
| Term | Meaning for one additional unit |
|---|---|
| MPC | cost borne by the consumer or producer making the decision |
| MEC | uncompensated cost imposed on third parties |
| MSC | total marginal opportunity cost to the decision-maker and third parties: |
| MPB | benefit received by the consumer or producer making the decision |
| MEB | uncompensated benefit received by third parties |
| MSB | total marginal benefit to the decision-maker and third parties: |
Every term is marginal: it concerns the next unit, not the total cost or benefit from all units. MEC and MEB may vary with quantity, so the private and social curves need not be parallel.
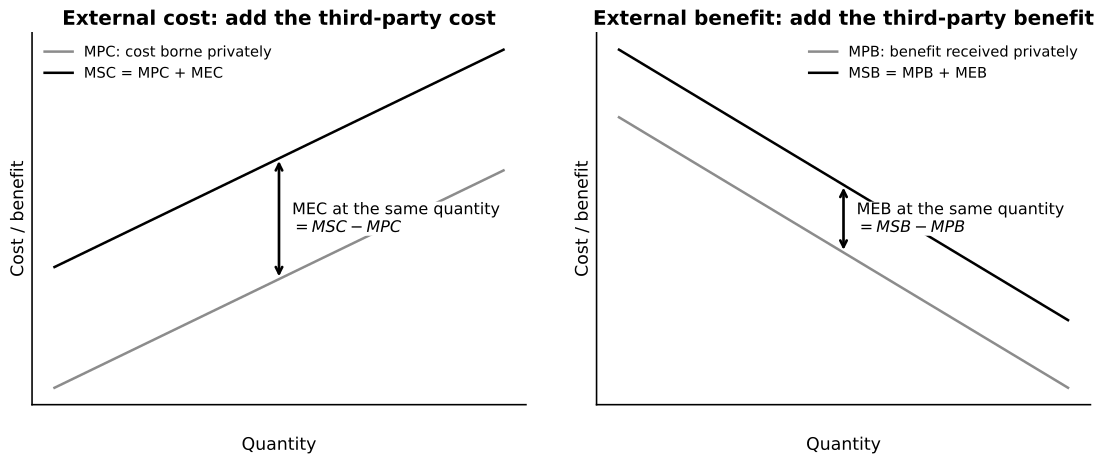
Caption: At the same quantity, the vertical distance is MEC: the extra cost imposed on third parties by one more unit. Likewise, is MEB: the extra third-party benefit. The diagram adds marginal components vertically because the values are measured per additional unit at the same quantity.
The free-market quantity is determined by the private values considered by buyers and sellers. The social optimum is where .
Use this sequence when reading any externality diagram:
- Identify who chooses the activity and which curves they perceive or bear.
- Find the private-market quantity from the relevant private benefit and private cost curves.
- Add the uncompensated third-party effect to obtain MSB or MSC.
- Find the socially optimal quantity where .
- Compare with and explain the vertical marginal gaps between them.
- The sum of those gaps is DWL; it is not the external cost or benefit on every unit.
Syllabus diagram rule
The syllabus states that a two-diagram approach is sufficient: use for negative externalities and for positive externalities. The four-case classification below is useful enrichment, but it is not necessary to memorise four separate diagrams.
Negative externalities
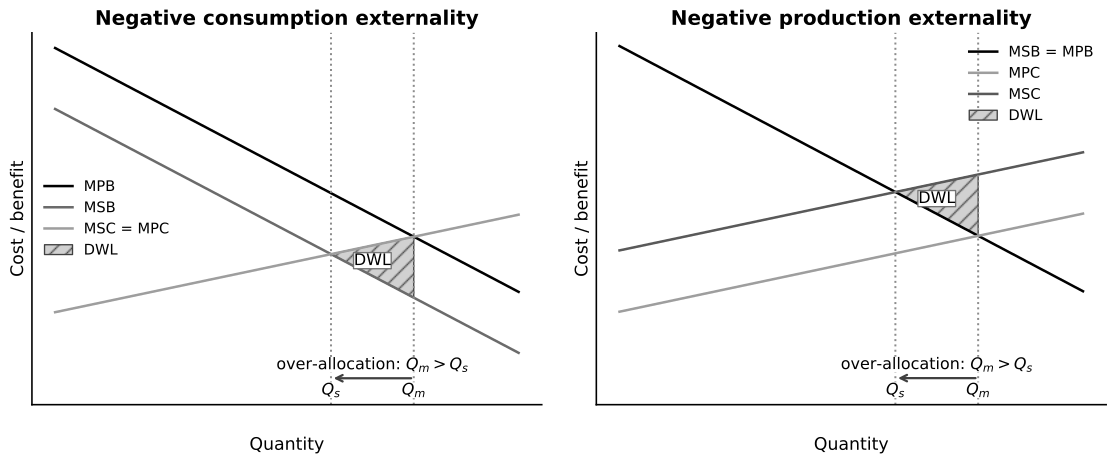
Caption: For a negative consumption externality, buyers choose where MPB meets MPC because they omit the harm to third parties; MSB is lower, so the social optimum is the smaller . For a negative production externality, sellers omit MEC, so MPC lies below MSC and the private market again produces . The hatched area adds the excess units’ marginal social costs above their marginal social benefits.
For units between the socially optimal and free-market quantities, . Reducing these units saves society more cost than the benefit forgone, so overproduction or overconsumption creates DWL.
This is an over-allocation of resources, not merely “too much” in a moral sense. Resources used for units from to create less social benefit than their social opportunity cost and could produce greater net benefit elsewhere.
- Production example: industrial emissions impose health and cleaning costs on nearby residents.
- Consumption example: smoking in shared spaces imposes health costs on non-smokers.
Traffic congestion may involve both users imposing delay on other road users and wider pollution effects. State the affected third party rather than relying on the label alone.
Positive externalities
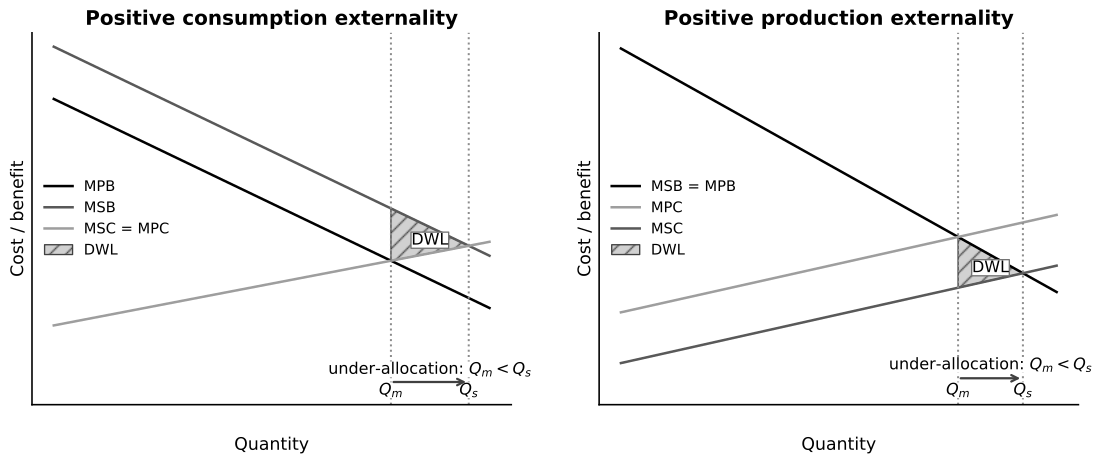
Caption: For a positive consumption externality, buyers consider MPB but not MEB, so MSB lies above MPB and . In the four-diagram treatment of a positive production externality, production creates benefits for third parties; these benefits reduce the net marginal cost to society, so MSC lies below the producer’s MPC and again . The hatched area is the sum of positive net social benefits forgone on units between and .
For unrealised units between the free-market and socially optimal quantities, . Expanding the activity adds more social benefit than social cost.
This is an under-allocation of resources: worthwhile units are not produced or consumed because part of their benefit cannot be captured by the decision-maker.
- Consumption example: education may generate benefits through greater civic participation or lower crime.
- Production example: research may create knowledge spillovers that other firms can use.
Corrective taxes
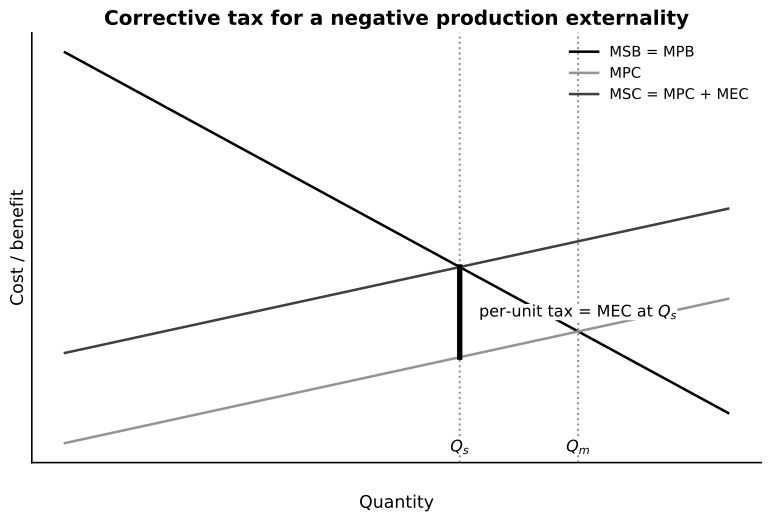
Caption: In the negative-production-externality case, the unregulated market uses MPC and chooses . A per-unit tax equal to MEC at raises the cost faced by producers so the post-tax private-cost curve passes through MSC at the social optimum. The vertical tax wedge is measured at ; it is not total external cost.
A well-calibrated tax internalises a negative externality by making the decision-maker face more of the social cost. Its strengths are flexibility, a continuing incentive to reduce harm and possible revenue for mitigation or redistribution.
Internalisation means the external effect is brought into the decision-maker’s private calculation. It does not mean the government literally eliminates all external harm. If the optimal activity remains positive, some external cost can remain because the units up to still create social benefit at least as large as social cost.
Its limitations include uncertain MEC and elasticity estimates, monitoring and evasion, regressivity, competitiveness effects, and weak effectiveness when behaviour is price-inelastic. The theoretically corrective rate is the marginal external cost at the efficient quantity, not total external cost.
Subsidies, direct provision and joint provision
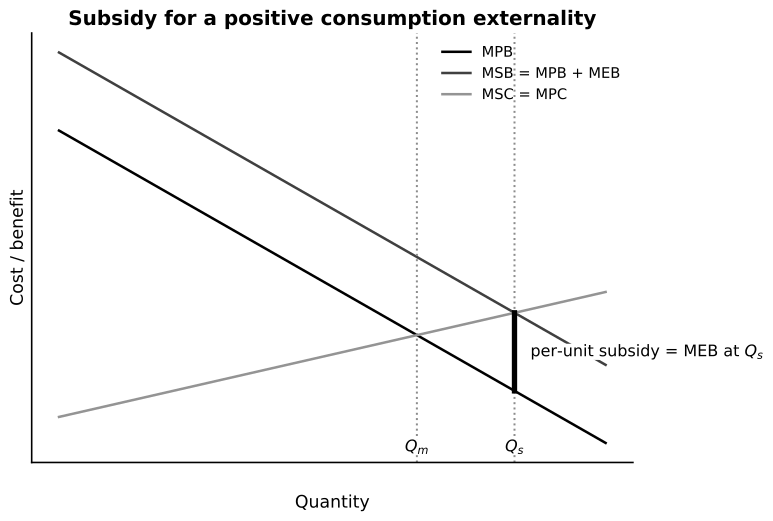
Caption: Without intervention, consumers act on MPB and choose . A per-unit subsidy equal to MEB at lowers the effective price paid or raises the effective private benefit until the decision-maker chooses the socially preferred quantity. The wedge is marginal and calibrated at , not the total external benefit from all education consumed.
A subsidy may preserve choice and encourage beneficial consumption or production. For a positive production externality, it may instead lower the effective marginal private cost toward marginal social cost. However, any subsidy has an opportunity cost, may fund units that would have occurred anyway, and may produce fraud or overprovision if badly calibrated.
Direct provision means government finances and arranges a service itself, although production may be carried out by a public body or contracted provider. It can guarantee a baseline level of access but may create fiscal cost, excess capacity or weak cost discipline.
Joint provision means public and private providers coexist. Government provision supplements the private-market quantity toward the social optimum while private providers continue to offer alternatives. This can improve access, variety and quality, but the government still needs information about the appropriate scale and must finance its share.
Quotas, tradable permits and bans
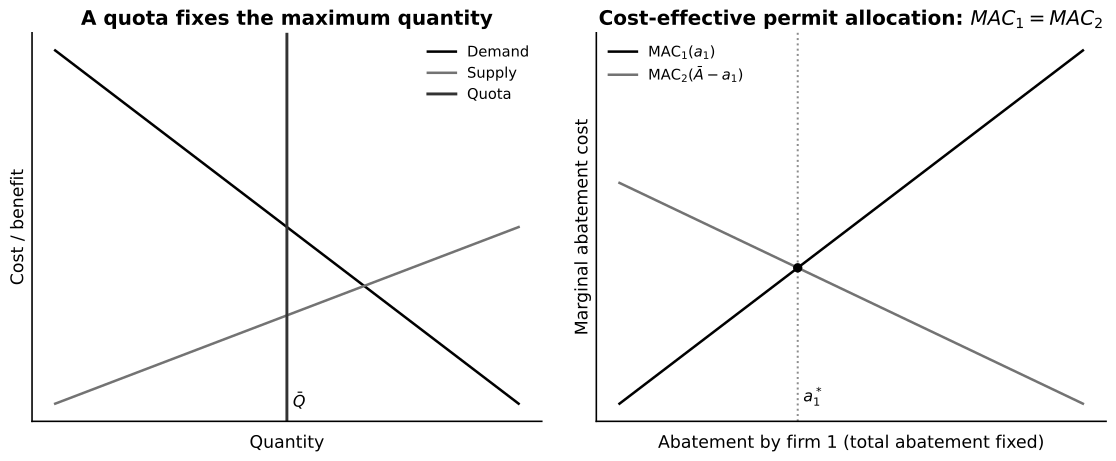
Caption: The left panel shows a legal cap fixing maximum output or emissions at . The right panel holds total abatement fixed and reallocates it until firms’ marginal abatement costs are equal. If , firm 1 can abate another unit more cheaply and sell a permit to firm 2; trading continues until no further cost-saving exchange remains.
A non-tradable quota fixes quantity but may allocate reductions inefficiently across firms. Tradable permits combine an overall cap with trading: firms with lower marginal abatement costs sell permits after undertaking more abatement. Effective systems require a credible cap, monitored emissions and enforceable ownership of permits.
A total ban is most defensible when marginal harm is extreme, safe and harmful use cannot be distinguished, and enforcement is feasible.
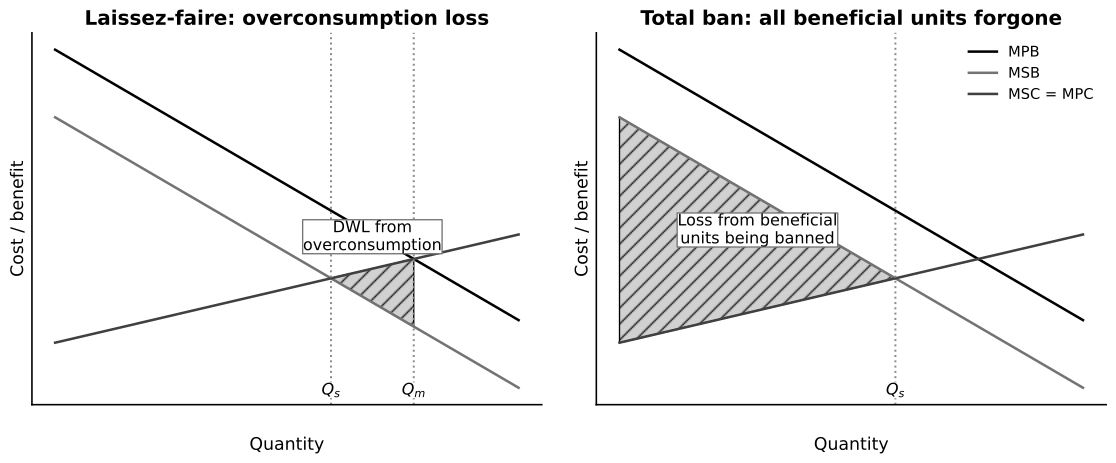
Caption: With no correction, the market produces beyond and creates DWL on harmful excess units. A total ban sets quantity to zero and also removes the units from zero to whose MSB exceeds MSC. A ban can therefore reduce harm yet sacrifice more net social benefit than a well-calibrated policy.
Rules, education and nudges
Standards, licensing and rules can impose a clear maximum harm level. Uniform rules are less cost-effective when firms face very different abatement costs, and they may provide little incentive to improve beyond compliance.
Public education can correct missing information and make future consequences more salient. Behavioural design may also use:
- salience bias by presenting the most decision-relevant costs prominently;
- loss aversion by truthfully framing an avoidable loss;
- the sunk-cost fallacy by reminding participants of effort already invested when encouraging completion of a beneficial programme. This can influence behaviour but should be transparent and not deceptive.
These measures are weak substitutes for pricing or regulation when the core problem is an external cost that decision-makers understand but do not bear. In policy appraisal, the government itself should ignore irrecoverable past costs and compare future social benefits with future social costs.
Choosing and evaluating policy
Ask:
- Is the divergence on the benefit side, cost side, or both?
- Can the external effect and relevant activity be measured?
- How responsive are consumers and producers?
- Is harm urgent, irreversible or cross-border?
- What are the distributional, fiscal and competitiveness effects?
- Are monitoring and enforcement credible?
- Would a package work better than a single instrument?
Common pitfalls
- Shifting a benefit curve for a production externality without explaining why.
- Treating every harmful private choice as an externality.
- Drawing a tax wedge unrelated to MEC at the social optimum.
- Treating tax revenue as a free welfare gain.
- Claiming permits eliminate emissions rather than cap them.
- Assuming public education solves a cost deliberately shifted onto third parties.
Return to Microeconomic Objectives and Policies.