Factor Immobility and Market Dominance
Factor immobility
Factor immobility means a factor of production cannot move readily between uses in response to changes in relative demand and returns. The syllabus analysis mainly concerns labour.
The problem is not that labour never moves. It is that adjustment is too slow, costly or incomplete for workers released from contracting activities to fill vacancies in expanding activities. Unemployment can therefore coexist with labour shortages.
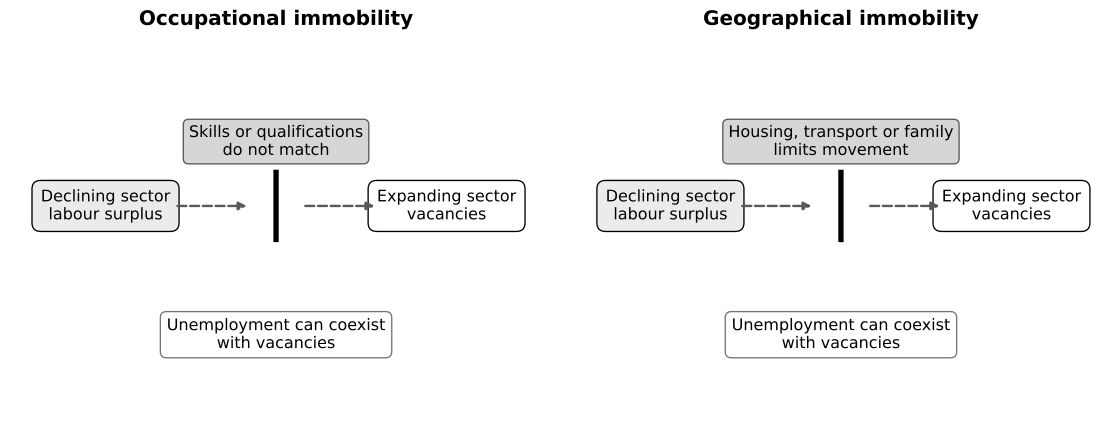
Caption: The vertical barrier represents a mismatch, not a legal wall. With occupational immobility, workers’ skills or qualifications do not match expanding-sector vacancies. With geographical immobility, housing, transport, family or location constraints prevent matching. In both cases unused labour coexists with unfilled vacancies, so actual output remains below potential output.
Diagram scope
Diagrammatic analysis of factor immobility is not required. Use the figure to understand the causal mechanism, not as a compulsory exam diagram.
Occupational immobility
Workers may lack the skills, qualifications, information or experience required by expanding industries. Structural change can therefore produce unemployment or underemployment even while vacancies exist.
The chain is:
changing pattern of demand → mismatch between available and required skills → labour remains unemployed or underemployed → actual output falls below potential output → productive efficiency and welfare fall
Two losses can be distinguished. Idle labour creates productive inefficiency because the economy operates inside its feasible production boundary. Persistent failure to move resources toward activities with higher social value can also prevent the desired allocation of output and contribute to allocative inefficiency.
Skill obsolescence may deepen over time, making the mismatch persistent and worsening inequity.
Policies include education and retraining subsidies, career information, credential recognition, apprenticeships and employer training incentives. Their effectiveness depends on course quality, worker aptitude, employer demand, participation and the time required to acquire marketable skills.
Geographical immobility
Workers may be unable or unwilling to move because of housing costs, transport limitations, family responsibilities, differences in licensing, or poor information about vacancies.
Policies include transport infrastructure, relocation or housing support, remote-work arrangements and regional development. A relocation subsidy will be weak if the main barrier is occupational; diagnosis must precede policy.
Market dominance
Market dominance exists when a firm has substantial and persistent power over price or market conditions. Sources include high barriers to entry, legal protection, control of essential inputs, network effects, brand loyalty and economies of scale.
Dominance is not identical to temporary popularity, a large market share or high profit in one year. The concern is durable ability to act without being tightly constrained by rivals, entrants or customers.
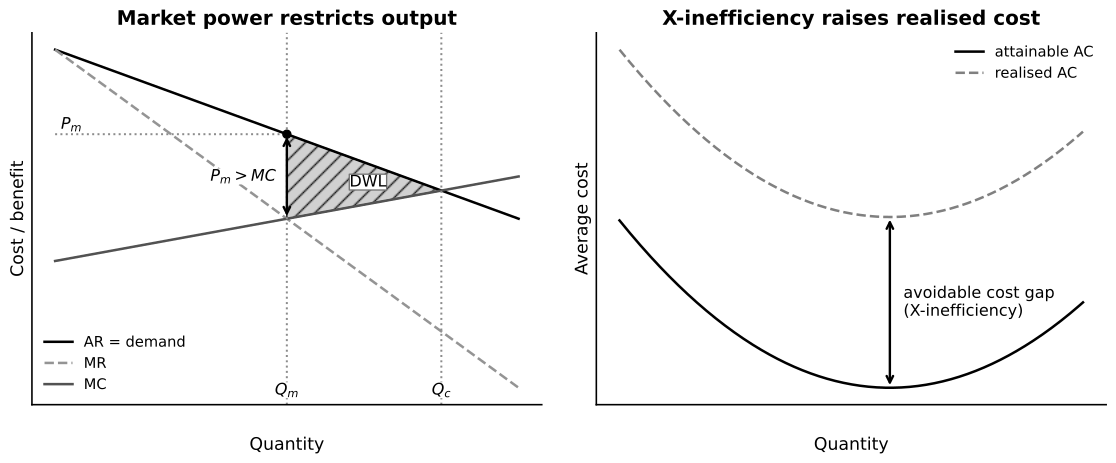
Caption: In the left panel, demand is also average revenue (AR). The firm chooses where MR equals MC, then charges on demand. The competitive no-externality benchmark is where demand (MSB) equals MC (MSC). Units from to are forgone even though willingness to pay exceeds marginal cost, creating DWL. The right panel shows X-inefficiency as realised average cost lying above the lowest attainable average cost.
Reading the market-power diagram
- AR or demand: price buyers are willing to pay for each quantity; under the benchmark this represents marginal social benefit.
- MR: additional revenue from selling one more unit. With a downward-sloping demand curve, MR lies below AR because selling another unit generally requires a lower price.
- MC: additional opportunity cost of producing one more unit; under the benchmark this represents marginal social cost.
- : profit-maximising output where .
- : price read from demand at ; it is not read from the MR curve.
- : allocatively efficient benchmark where , equivalently under the stated assumptions.
At , . Hence the next units up to would be valued by buyers more than the resources needed to produce them. The shaded DWL is the sum of these unrealised vertical gains, not the firm’s profit and not a transfer to the producer.
In the standard market-power model with no externalities, measures marginal social benefit and measures marginal social cost. At the firm’s restricted output, , so society values an additional unit more than the resources needed to produce it. Output is therefore below the allocatively efficient quantity.
Possible consequences include:
- allocative inefficiency under the standard no-externality benchmark because and output is below the socially desirable level;
- X-inefficiency because weak pressure allows avoidable organisational slack and higher costs;
- lower quality or variety, or slower innovation, where rivalry would otherwise discipline the firm;
- exclusionary conduct that protects market power;
- inequitable access where essential services are priced beyond some households’ reach.
These outcomes are possible, not automatic. A large firm may exploit economies of scale, coordinate a network, fund risky R&D or deliver consistent quality. Market concentration alone is therefore not proof of abuse or net social harm.
X-inefficiency should also be distinguished from an unavoidable high cost. It exists only when realised cost exceeds the lowest attainable cost with the available technology and input prices, owing for example to weak managerial discipline or organisational slack.
Policies toward dominance
| Policy | Intended mechanism | Main evaluation issue |
|---|---|---|
| Competition law | Deter collusion and exclusionary abuse | Requires evidence about conduct and market definition. |
| Merger control | Prevent durable harmful concentration | May block scale economies or innovation. |
| Lower entry/switching barriers | Increase contestability | Entry may remain uneconomic in a natural monopoly. |
| Access/interoperability rules | Prevent foreclosure of essential networks | Pricing access and protecting investment are difficult. |
| Price or quality regulation | Limit consumer exploitation | A cap set too low may weaken maintenance and investment. |
| Public ownership | Directly control a natural-monopoly service | Risks fiscal cost, political interference and X-inefficiency. |
Breaking up a natural monopoly may duplicate fixed infrastructure and raise average cost. Good policy targets the source and exercise of market power rather than firm size by itself.
Integrated judgement
Ask:
- What blocks resource movement or competitive pressure?
- Is the barrier occupational, geographical, legal, informational, technological or strategic?
- How large and persistent is the efficiency loss?
- Does the instrument target that mechanism?
- What scale, innovation, enforcement and equity trade-offs arise?
Common pitfalls
- Treating all unemployment as factor immobility.
- Recommending training for a purely geographical barrier.
- Equating concentration with abuse.
- Assuming more firms must lower industry cost.
- Ignoring dynamic efficiency, network effects and implementation costs.
Return to Microeconomic Objectives and Policies.